Planning Center Tips: How to Build a Powerful Leadership Overview Dashboard with Widgets in Planning Center
Looking to empower your church leadership team with data-driven insights?
Planning Center makes it easy to create a customized dashboard that tracks attendance, giving, demographics, and more — all in one place. In this guide, we’ll walk you through the basics of dashboards, how to add widgets, and how to build a leadership overview dashboard that keeps your team aligned and informed.
What Is a Dashboard in Planning Center?
Every Planning Center user has access to the Home app, a central hub that pulls together data from across your church’s Planning Center products. Within Home, you’ll find two key features:
Tasks: Manage your to-dos and follow-ups.
Dashboards: Visualize data with customizable widgets.
Your default dashboard is called My Dashboard, and it’s fully customizable to show the data that matters most to you.
How to Add Your First Widget
To start building your dashboard:
Click Add Widget in the top right corner.
Choose a Planning Center product (like People, Giving, or Check-Ins).
Select a widget type. These vary depending on the product selected.
Customize widget configuration.
Once added, widgets appear at the bottom of your dashboard. You can drag and drop them to organize your layout.
Customizing Widgets for Better Insights
Each widget includes a settings icon (⚙️) that lets you:
Filter data by group, campus, or timeframe.
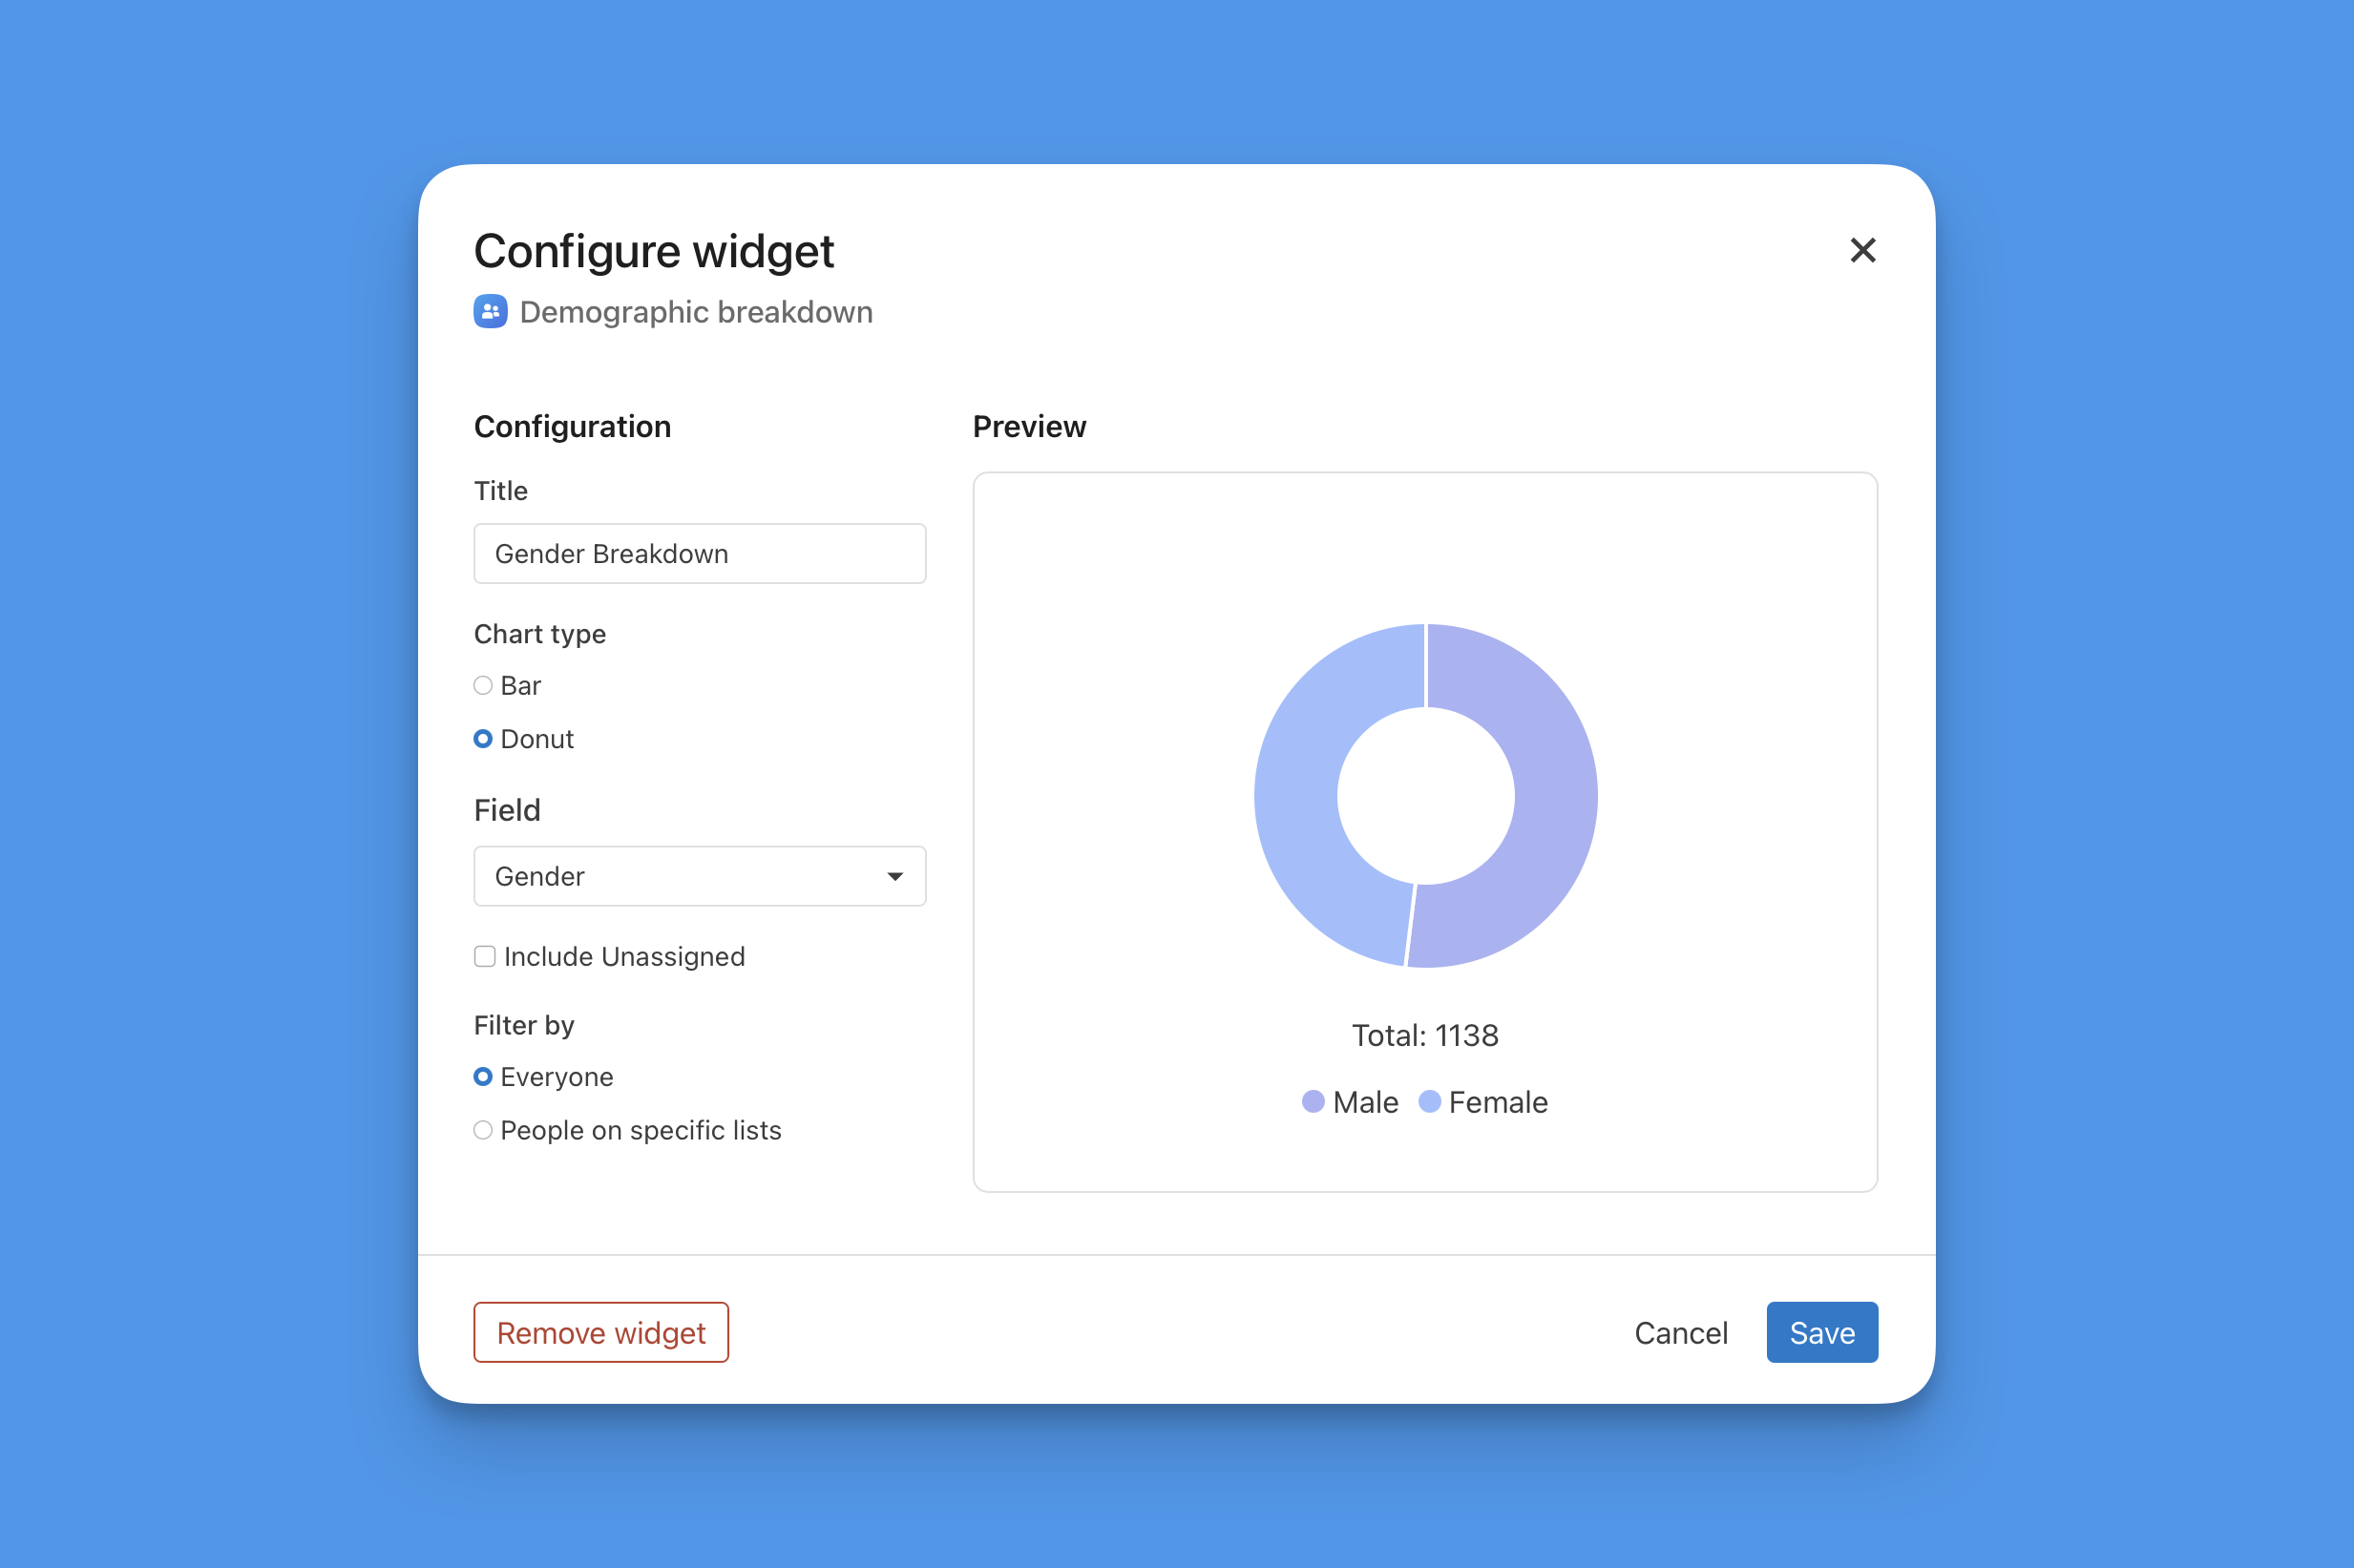
Switch between visual styles (bar chart, donut graph, etc.).
Remove or update widgets as needed.
Explore widgets across all Planning Center apps to unlock even more customization options.
Organizing Dashboards with Tabs and Collaborators
In addition to the standard My Dashboard tab, you can create more tabs to organize your data and share with others. Add collaborators to the dashboard to keep everyone informed and engaged with the data that matters most.
To manage collaborators:
Click the three dots in the tab settings.
Add users as Viewers (can view only) or Managers (can add widgets).
Search by name and assign roles.
🔒 Permissions Tip: The visibility of products on a dashboard is based on the permissions of the person who created it. This means collaborators can view widgets even if they don’t have access to the underlying product. Just make sure the dashboard creator maintains access — otherwise, widgets may stop displaying data.
Building a Leadership Overview Dashboard
A leadership overview dashboard is your go-to tool for sharing high-level insights with your church’s leadership team. Create a new tab and add your leaders as collaborators. Here are the top widget categories to include:
1. Attendance Metrics
Track who’s showing up and when:
View trends over 12 months, 13 weeks, or 30 days.
Filter by regular attendees, guests, or volunteers.
Compare year-over-year attendance.
Focus on specific events (e.g., Kids Weekend Service).
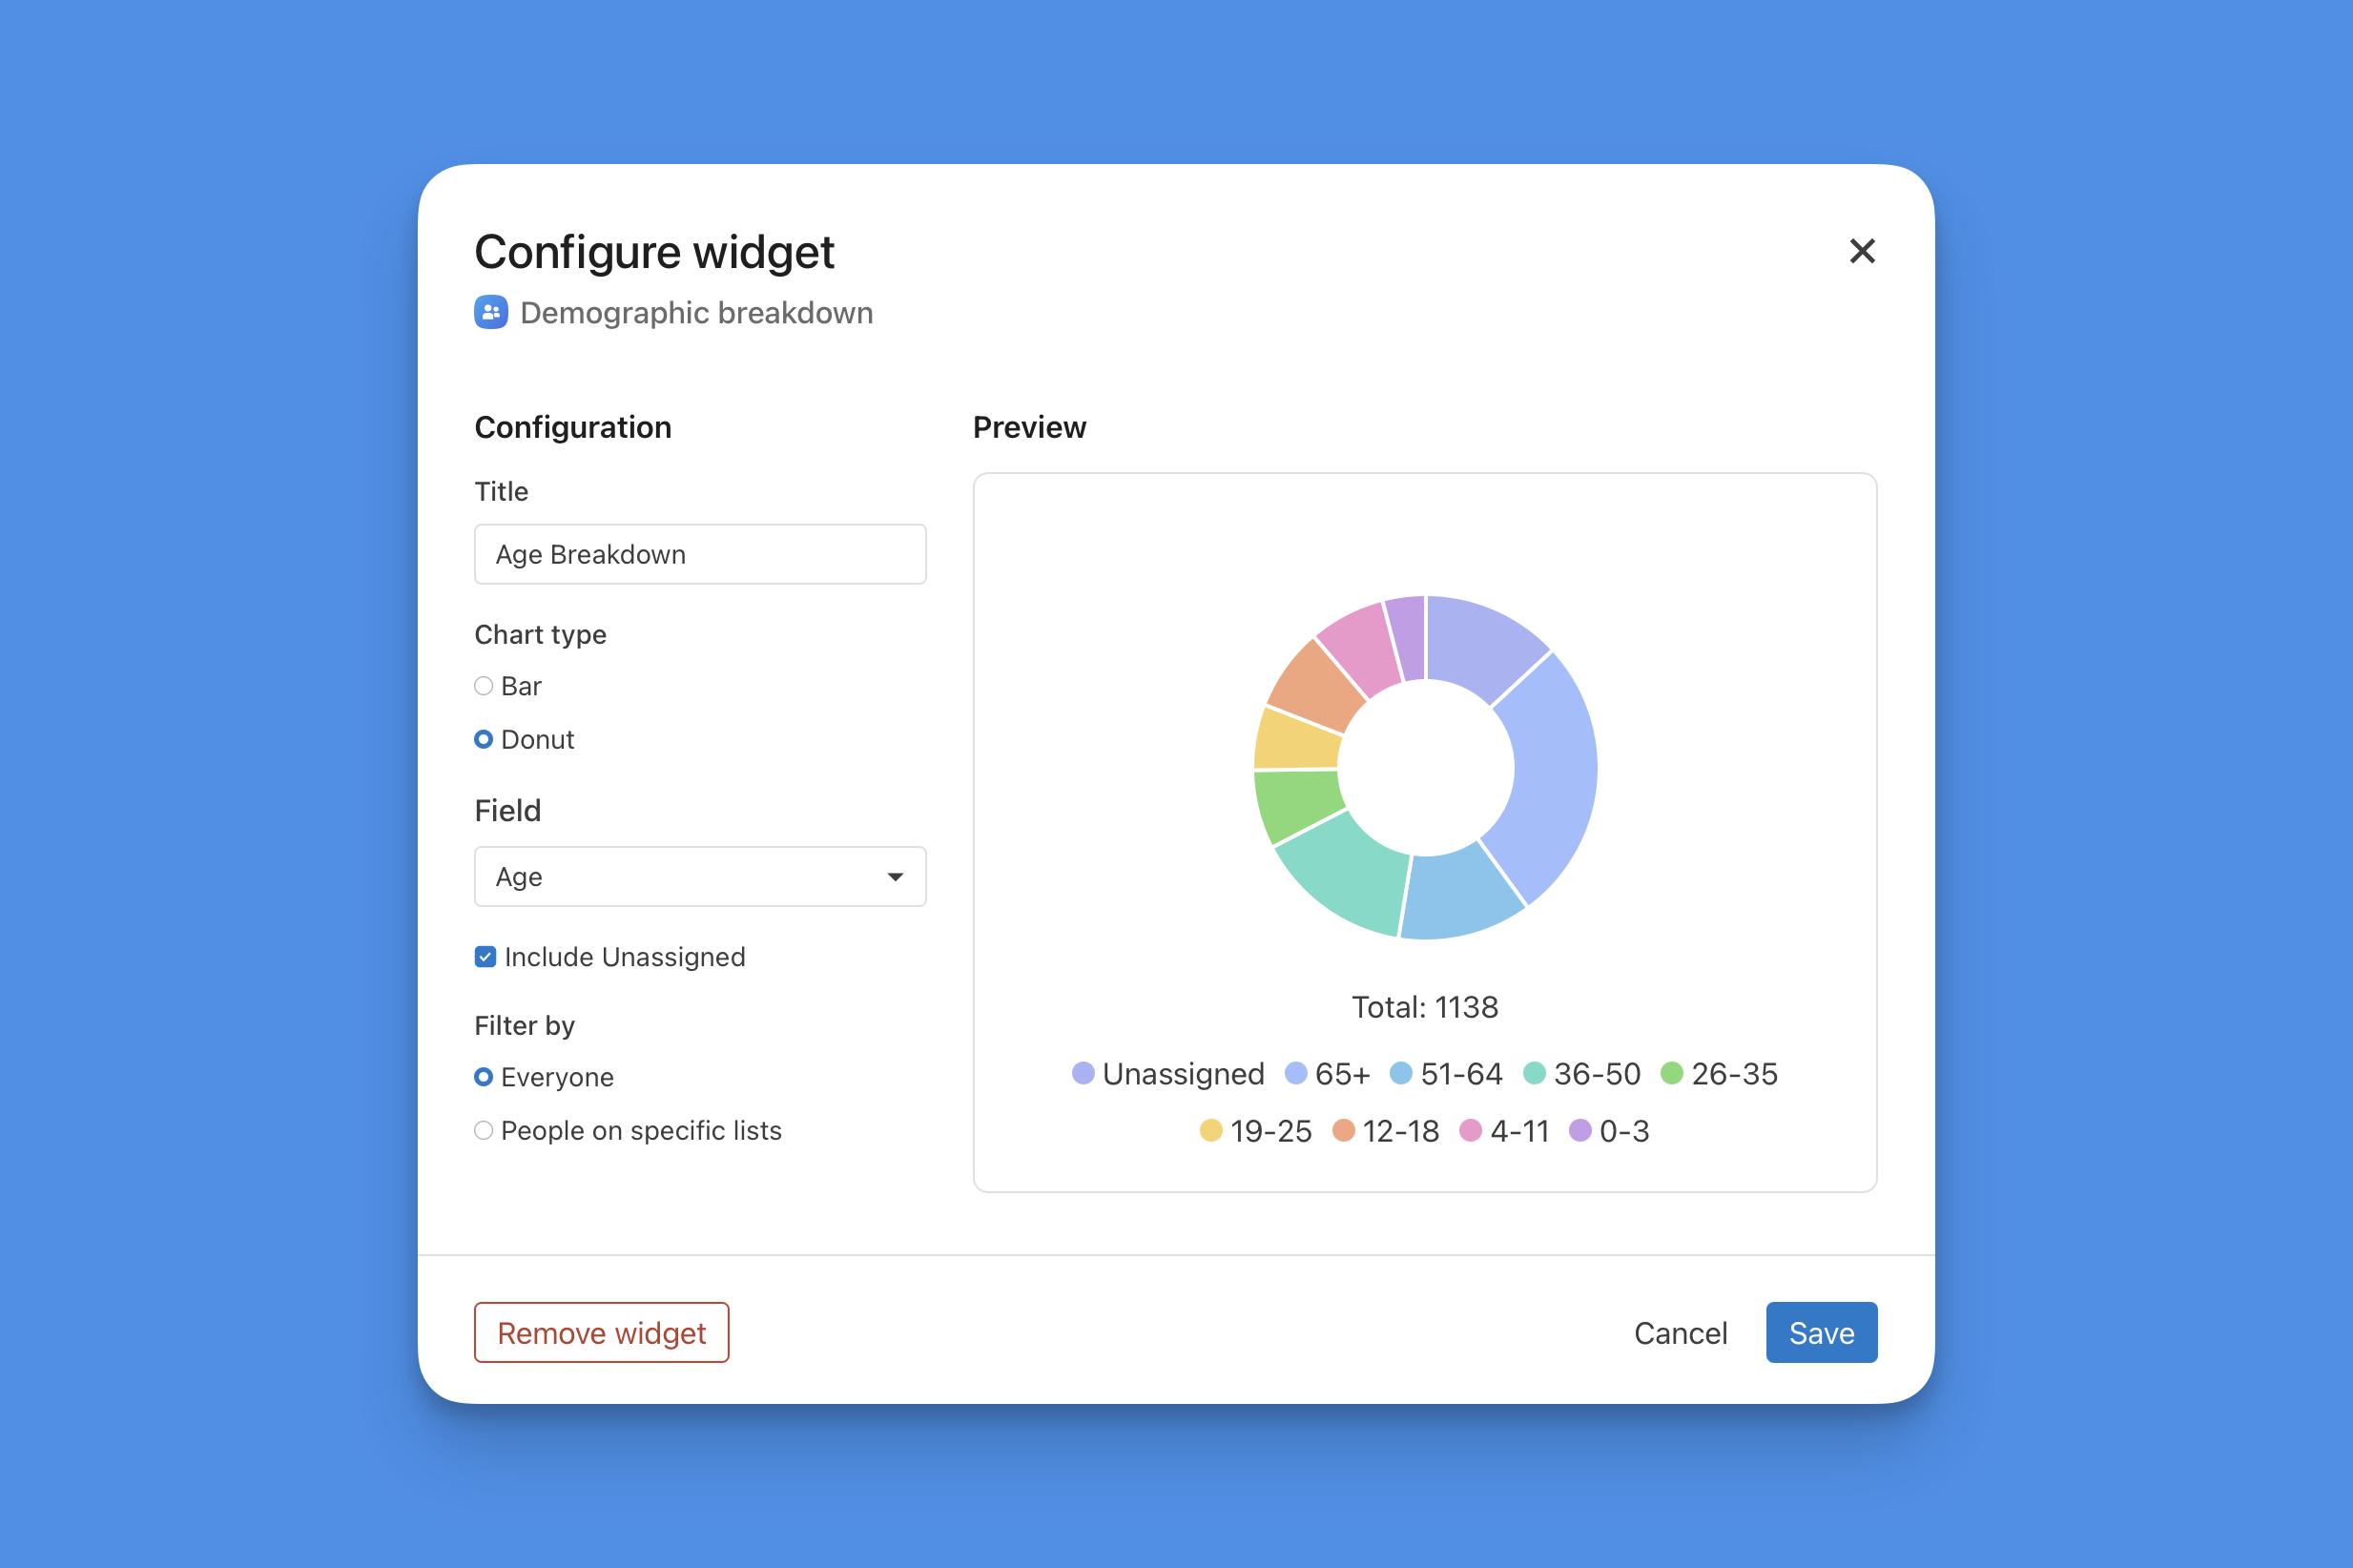
2. Demographics Insights
Understand your congregation better:
Age, gender, marital status
Campus popularity
Membership types
Custom fields like baptism dates or growth track completion
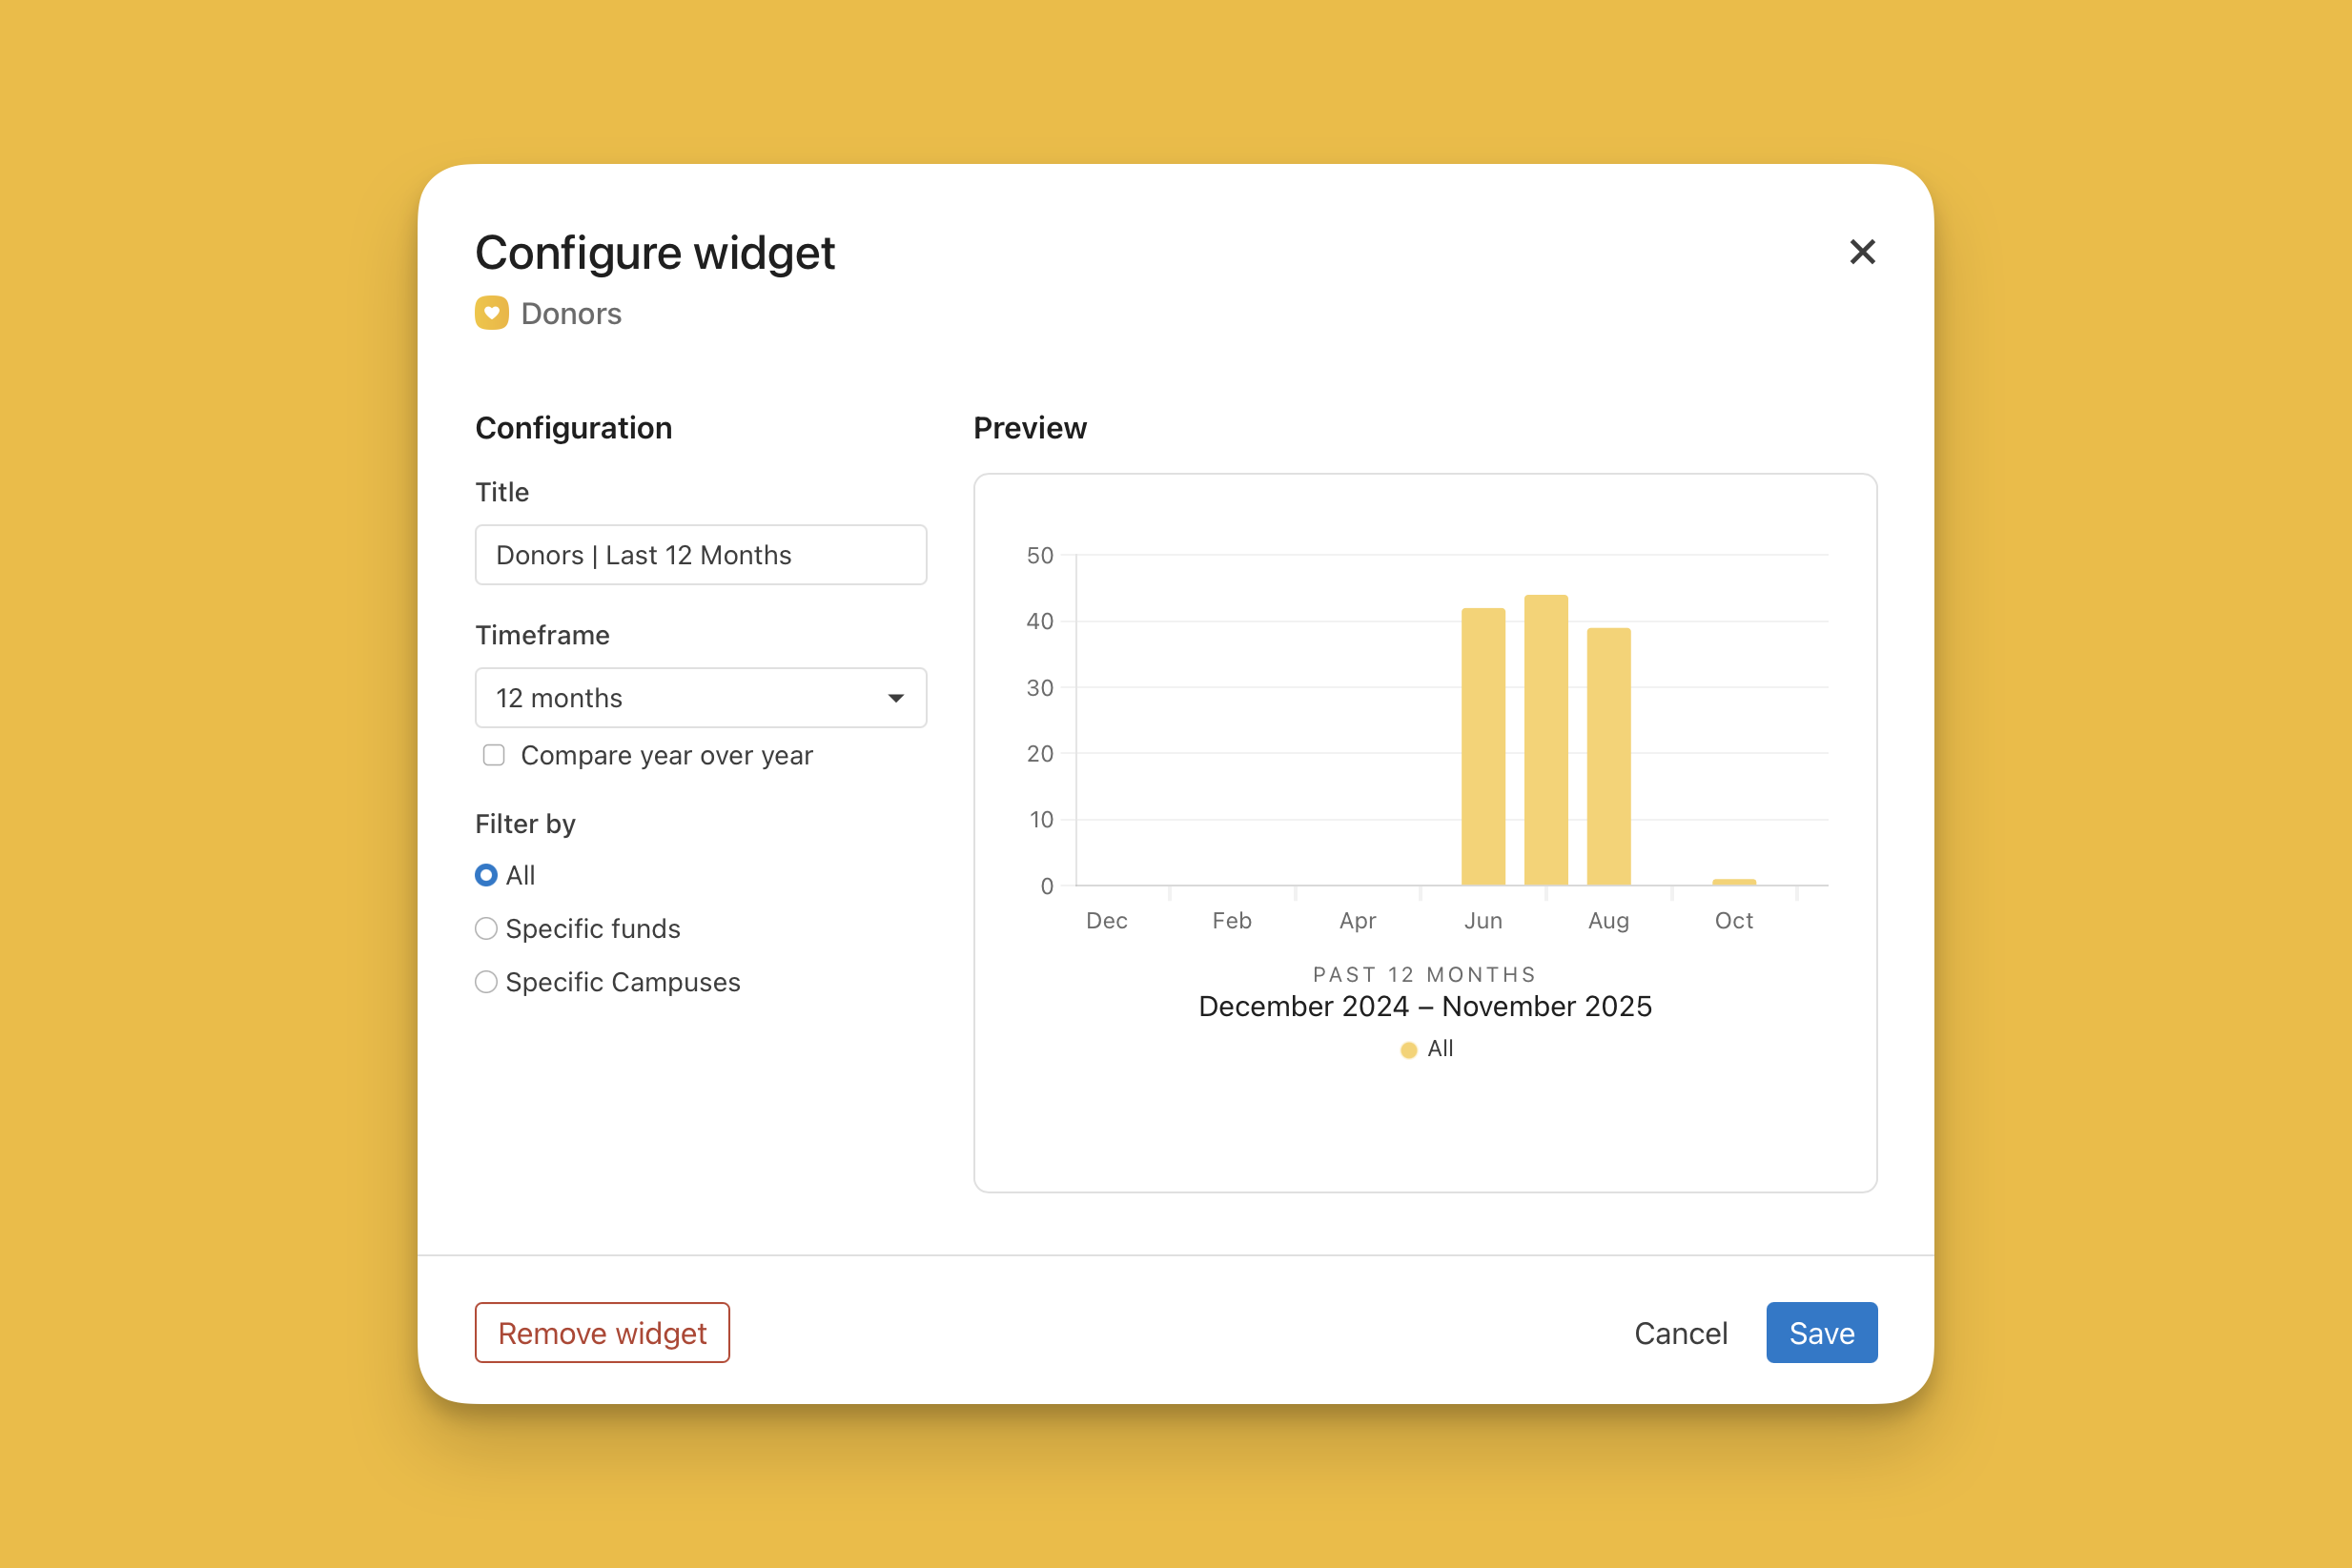
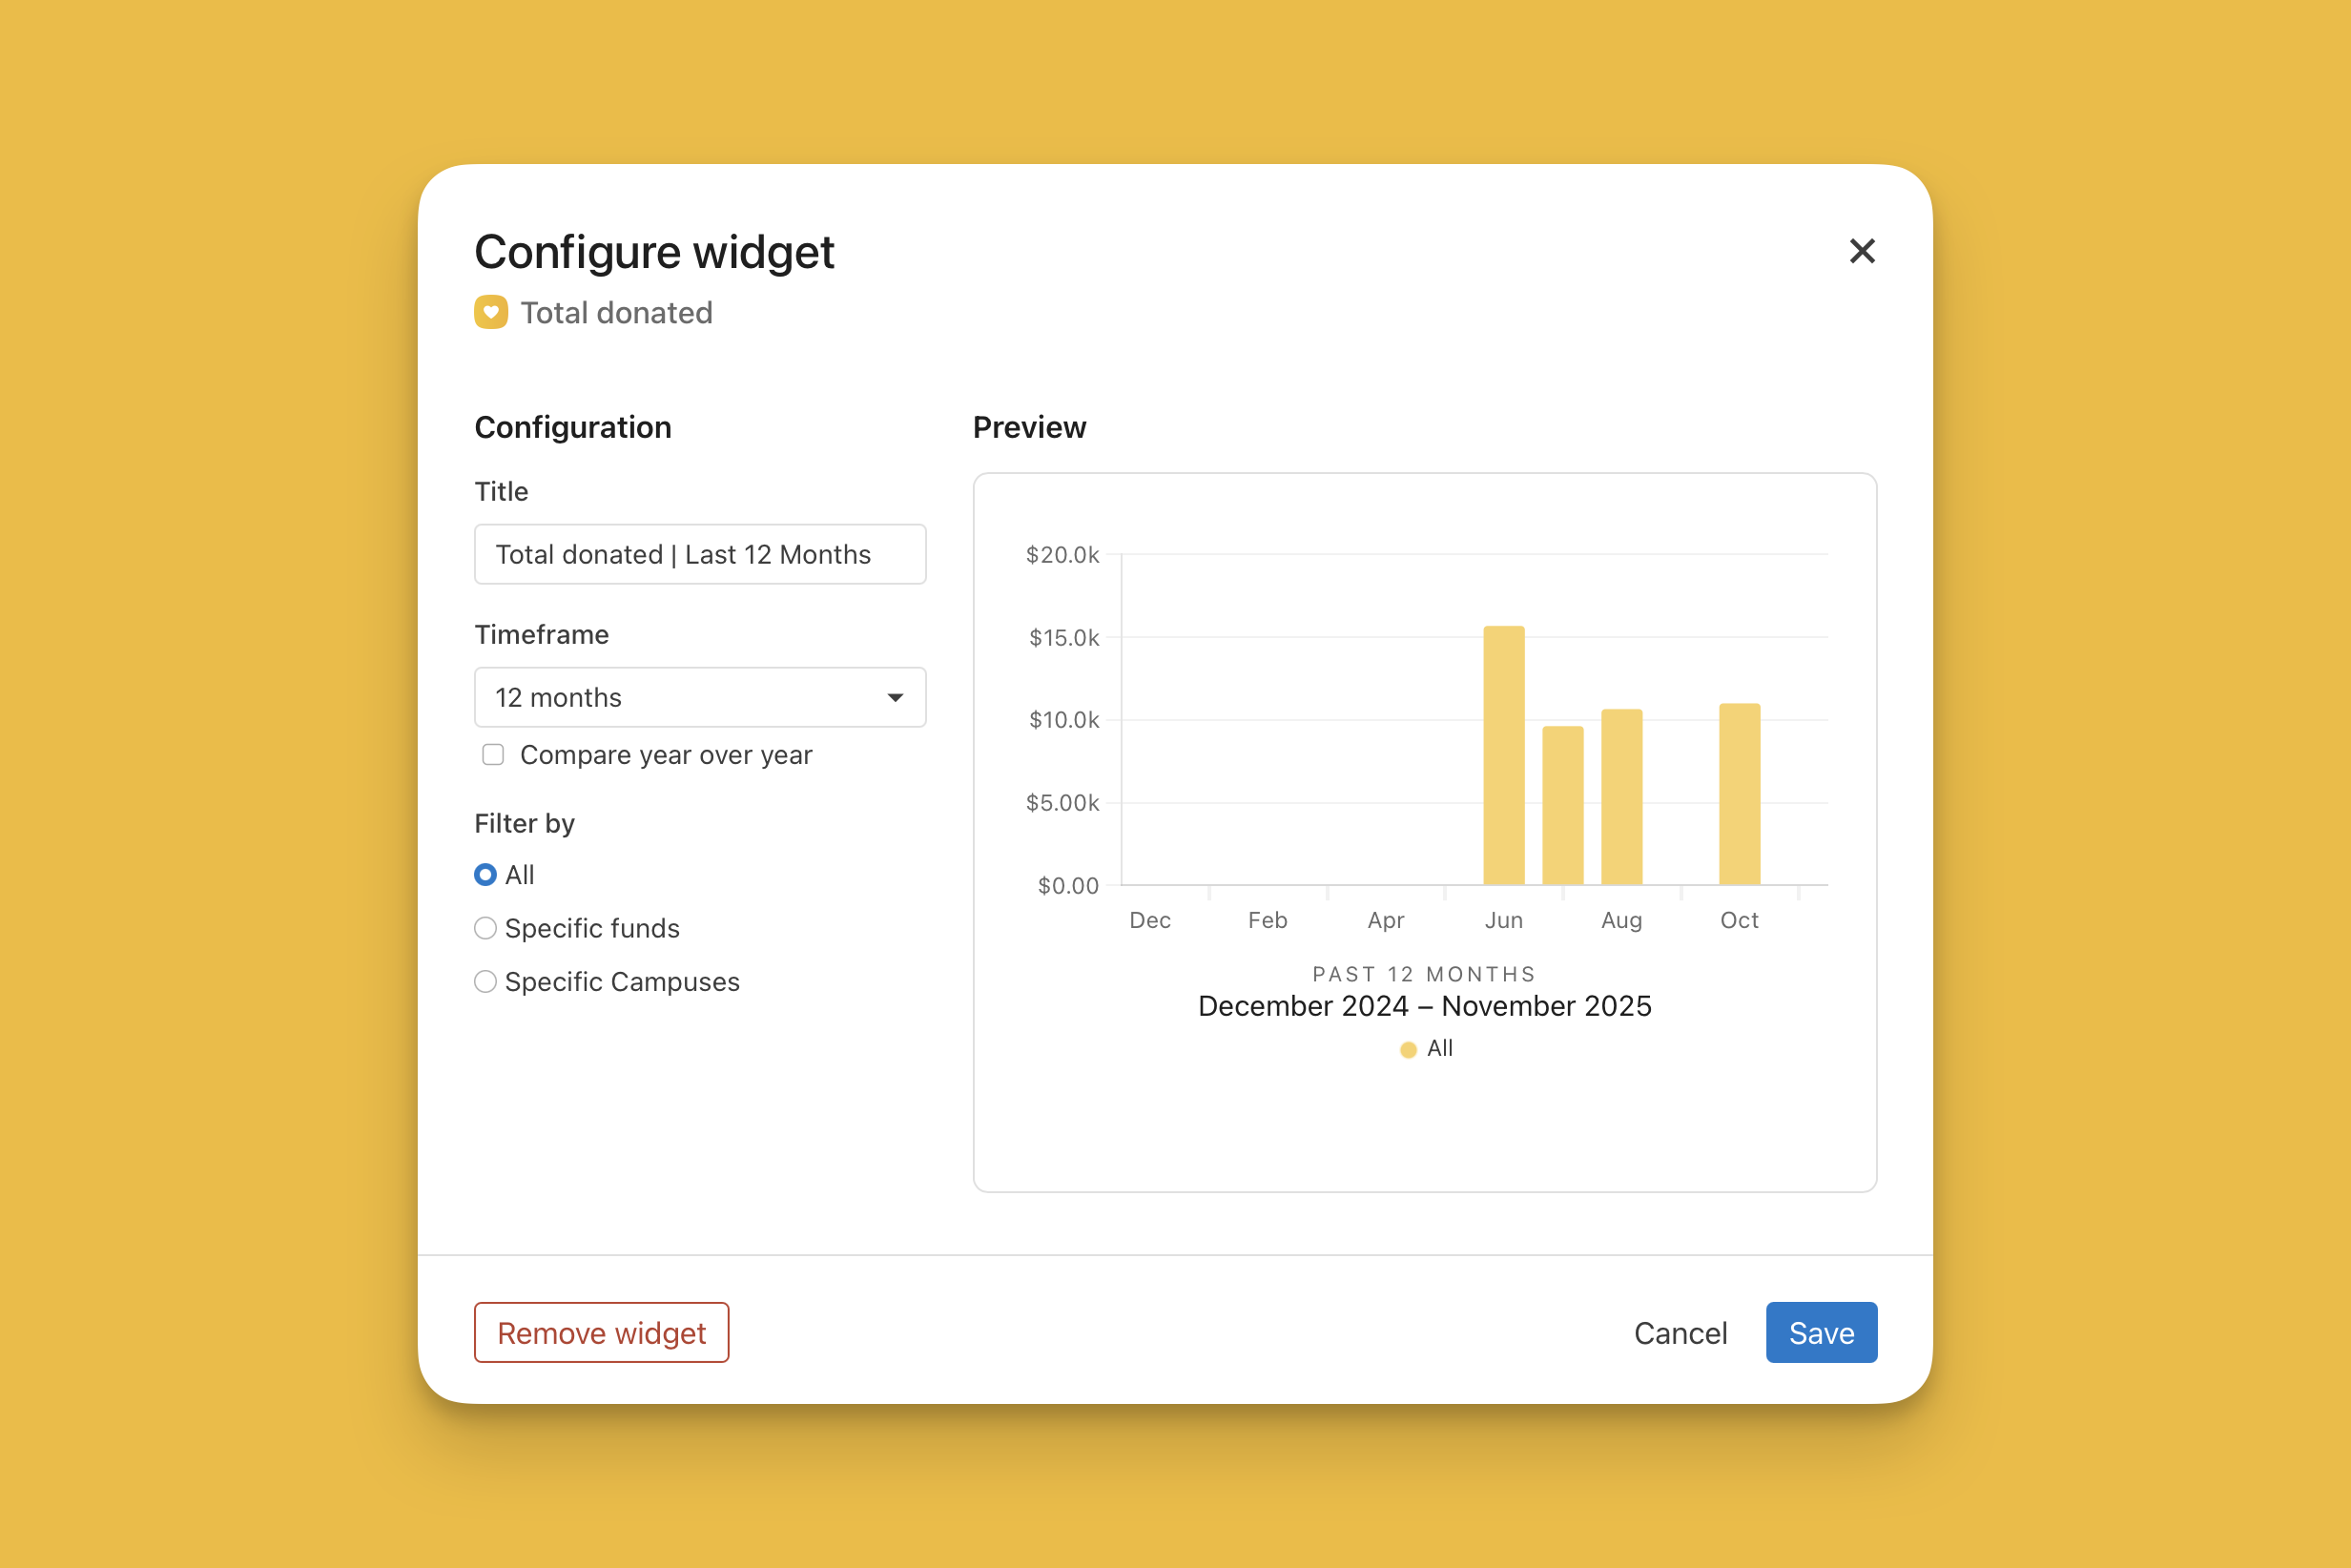
3. Giving Data
Monitor financial health and donor engagement:
Total giving over time
Fund, campus, or payment method
Number of donors and first-time givers
Forecast recurring donations
Top 10 Widgets for Church Leadership Dashboards
With option after powerful option, you can create a leadership overview dashboard that is customized to fit your church’s needs. Need some inspiration? We’ve collected our top 10 recommendations and shared our configuration to help you get started.
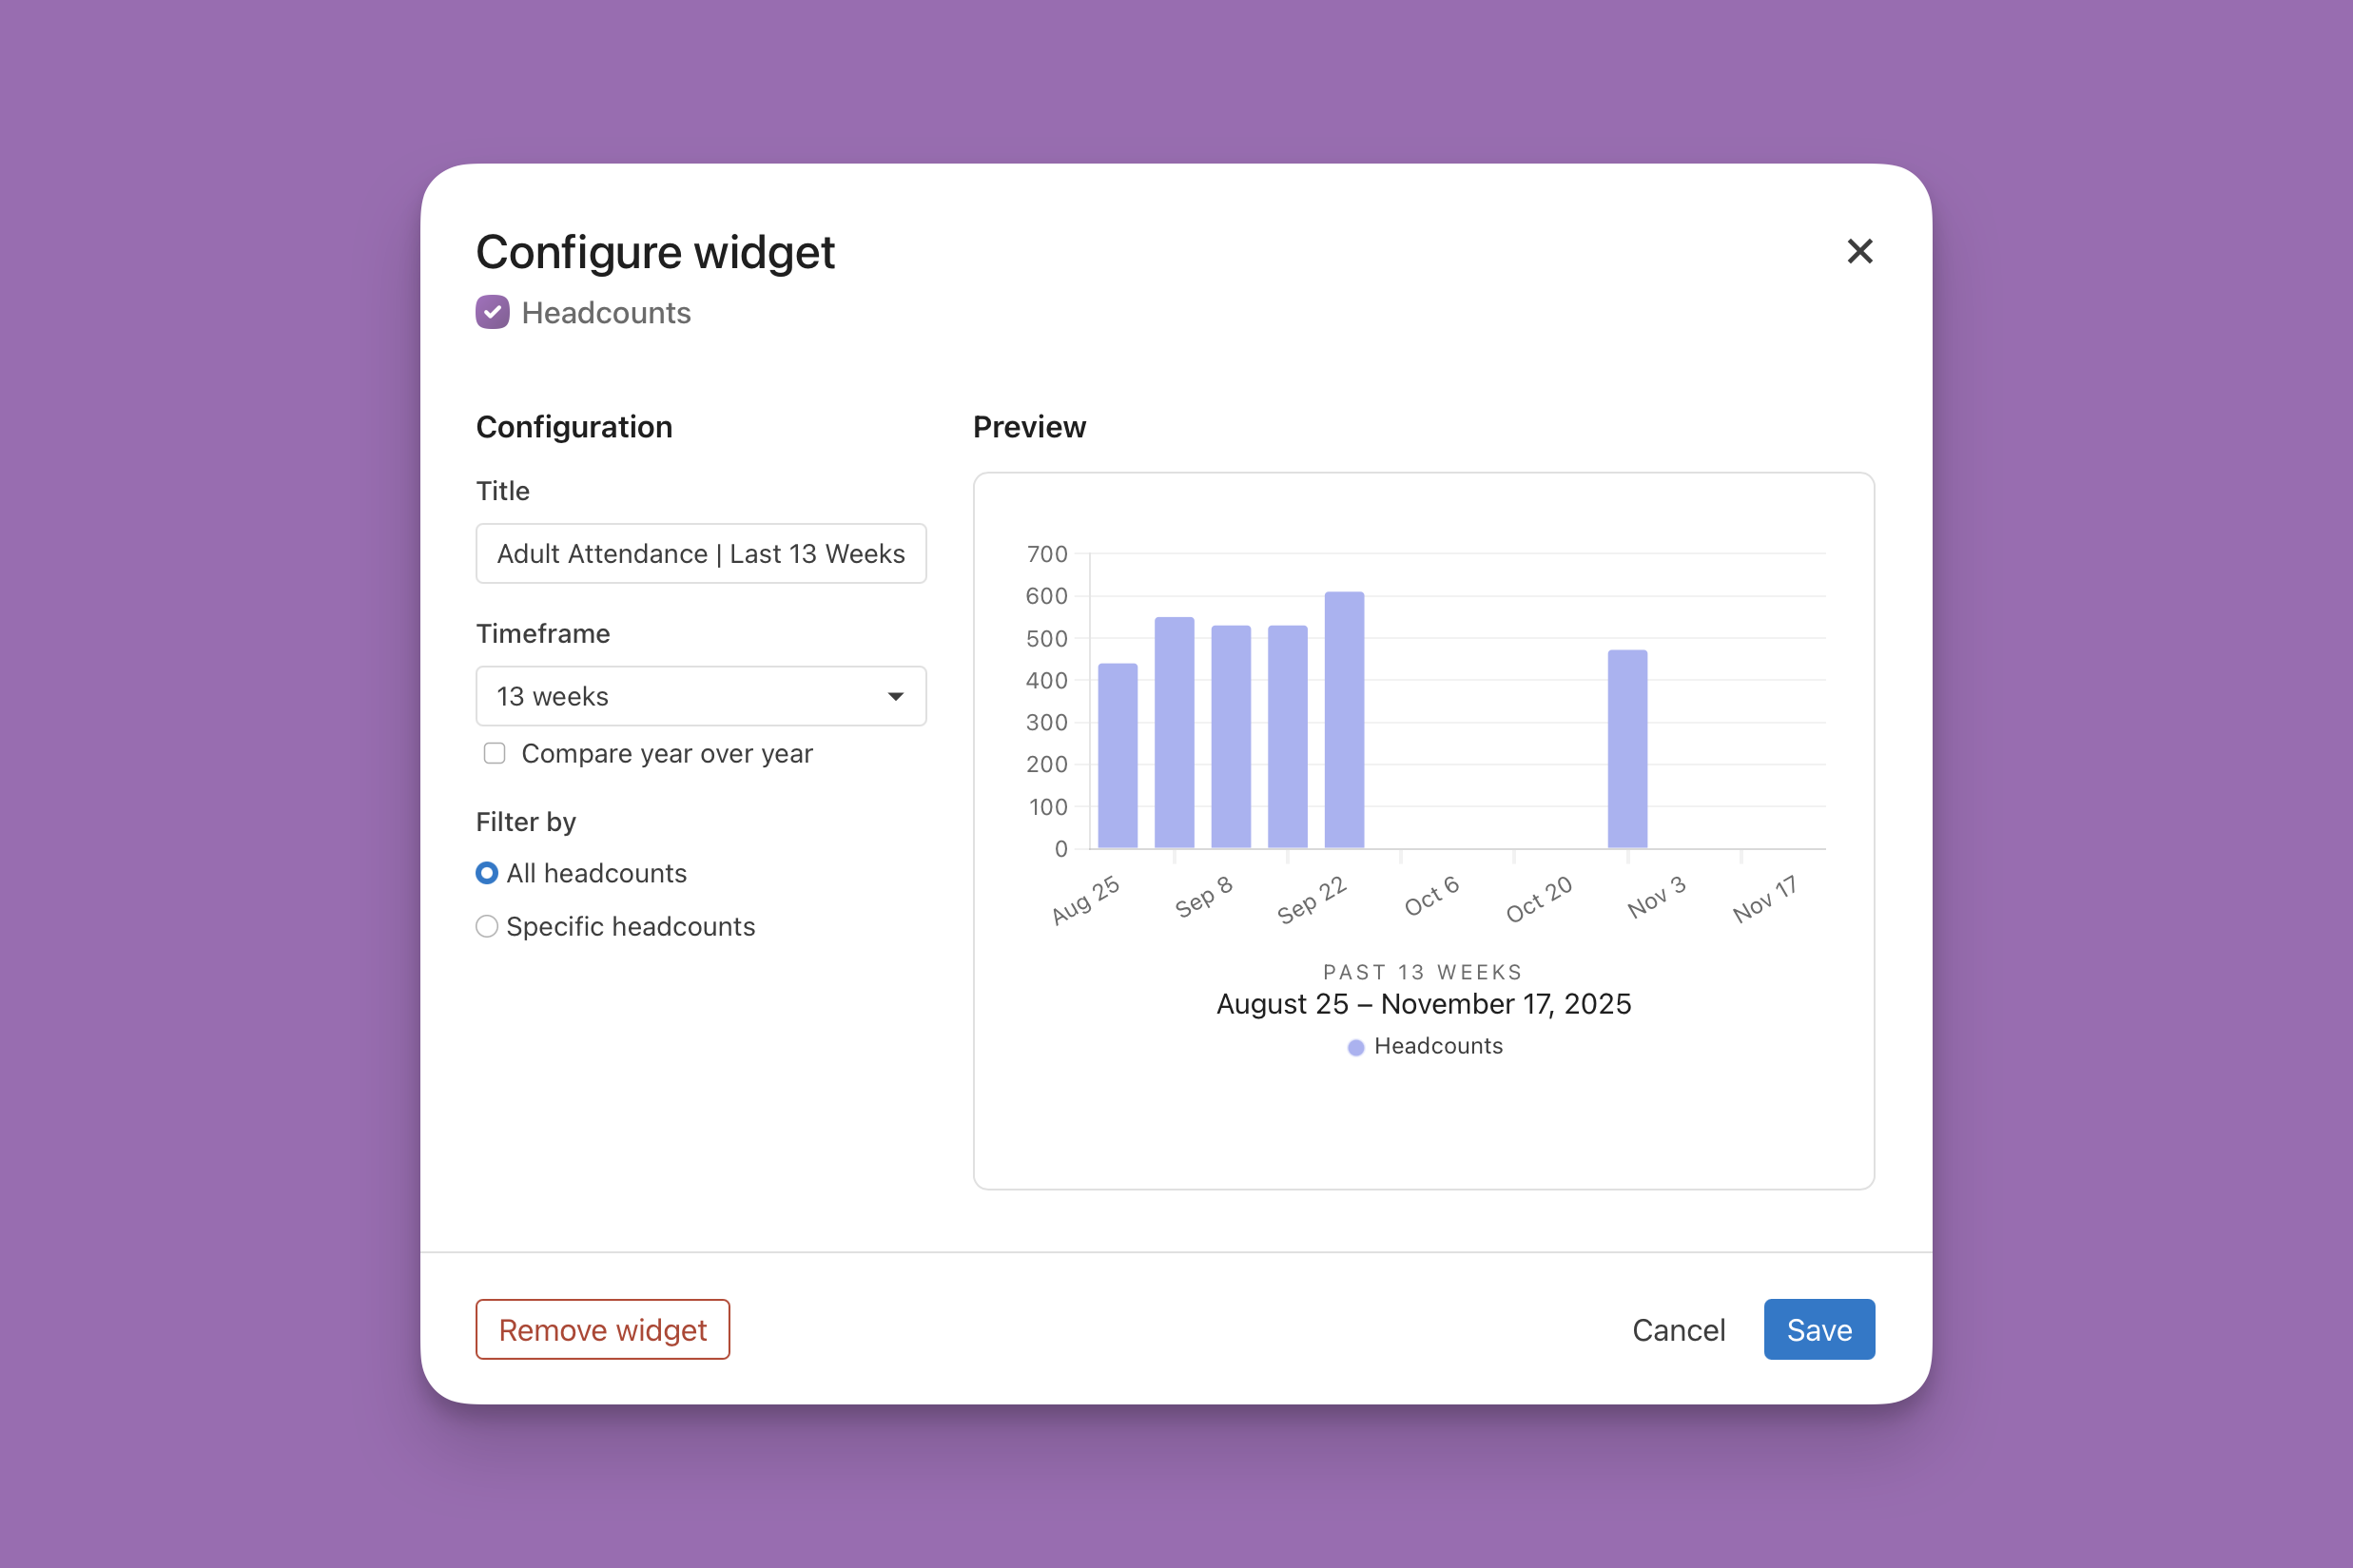
Adult Attendance | Last 13 weeks (Using Headcounts)
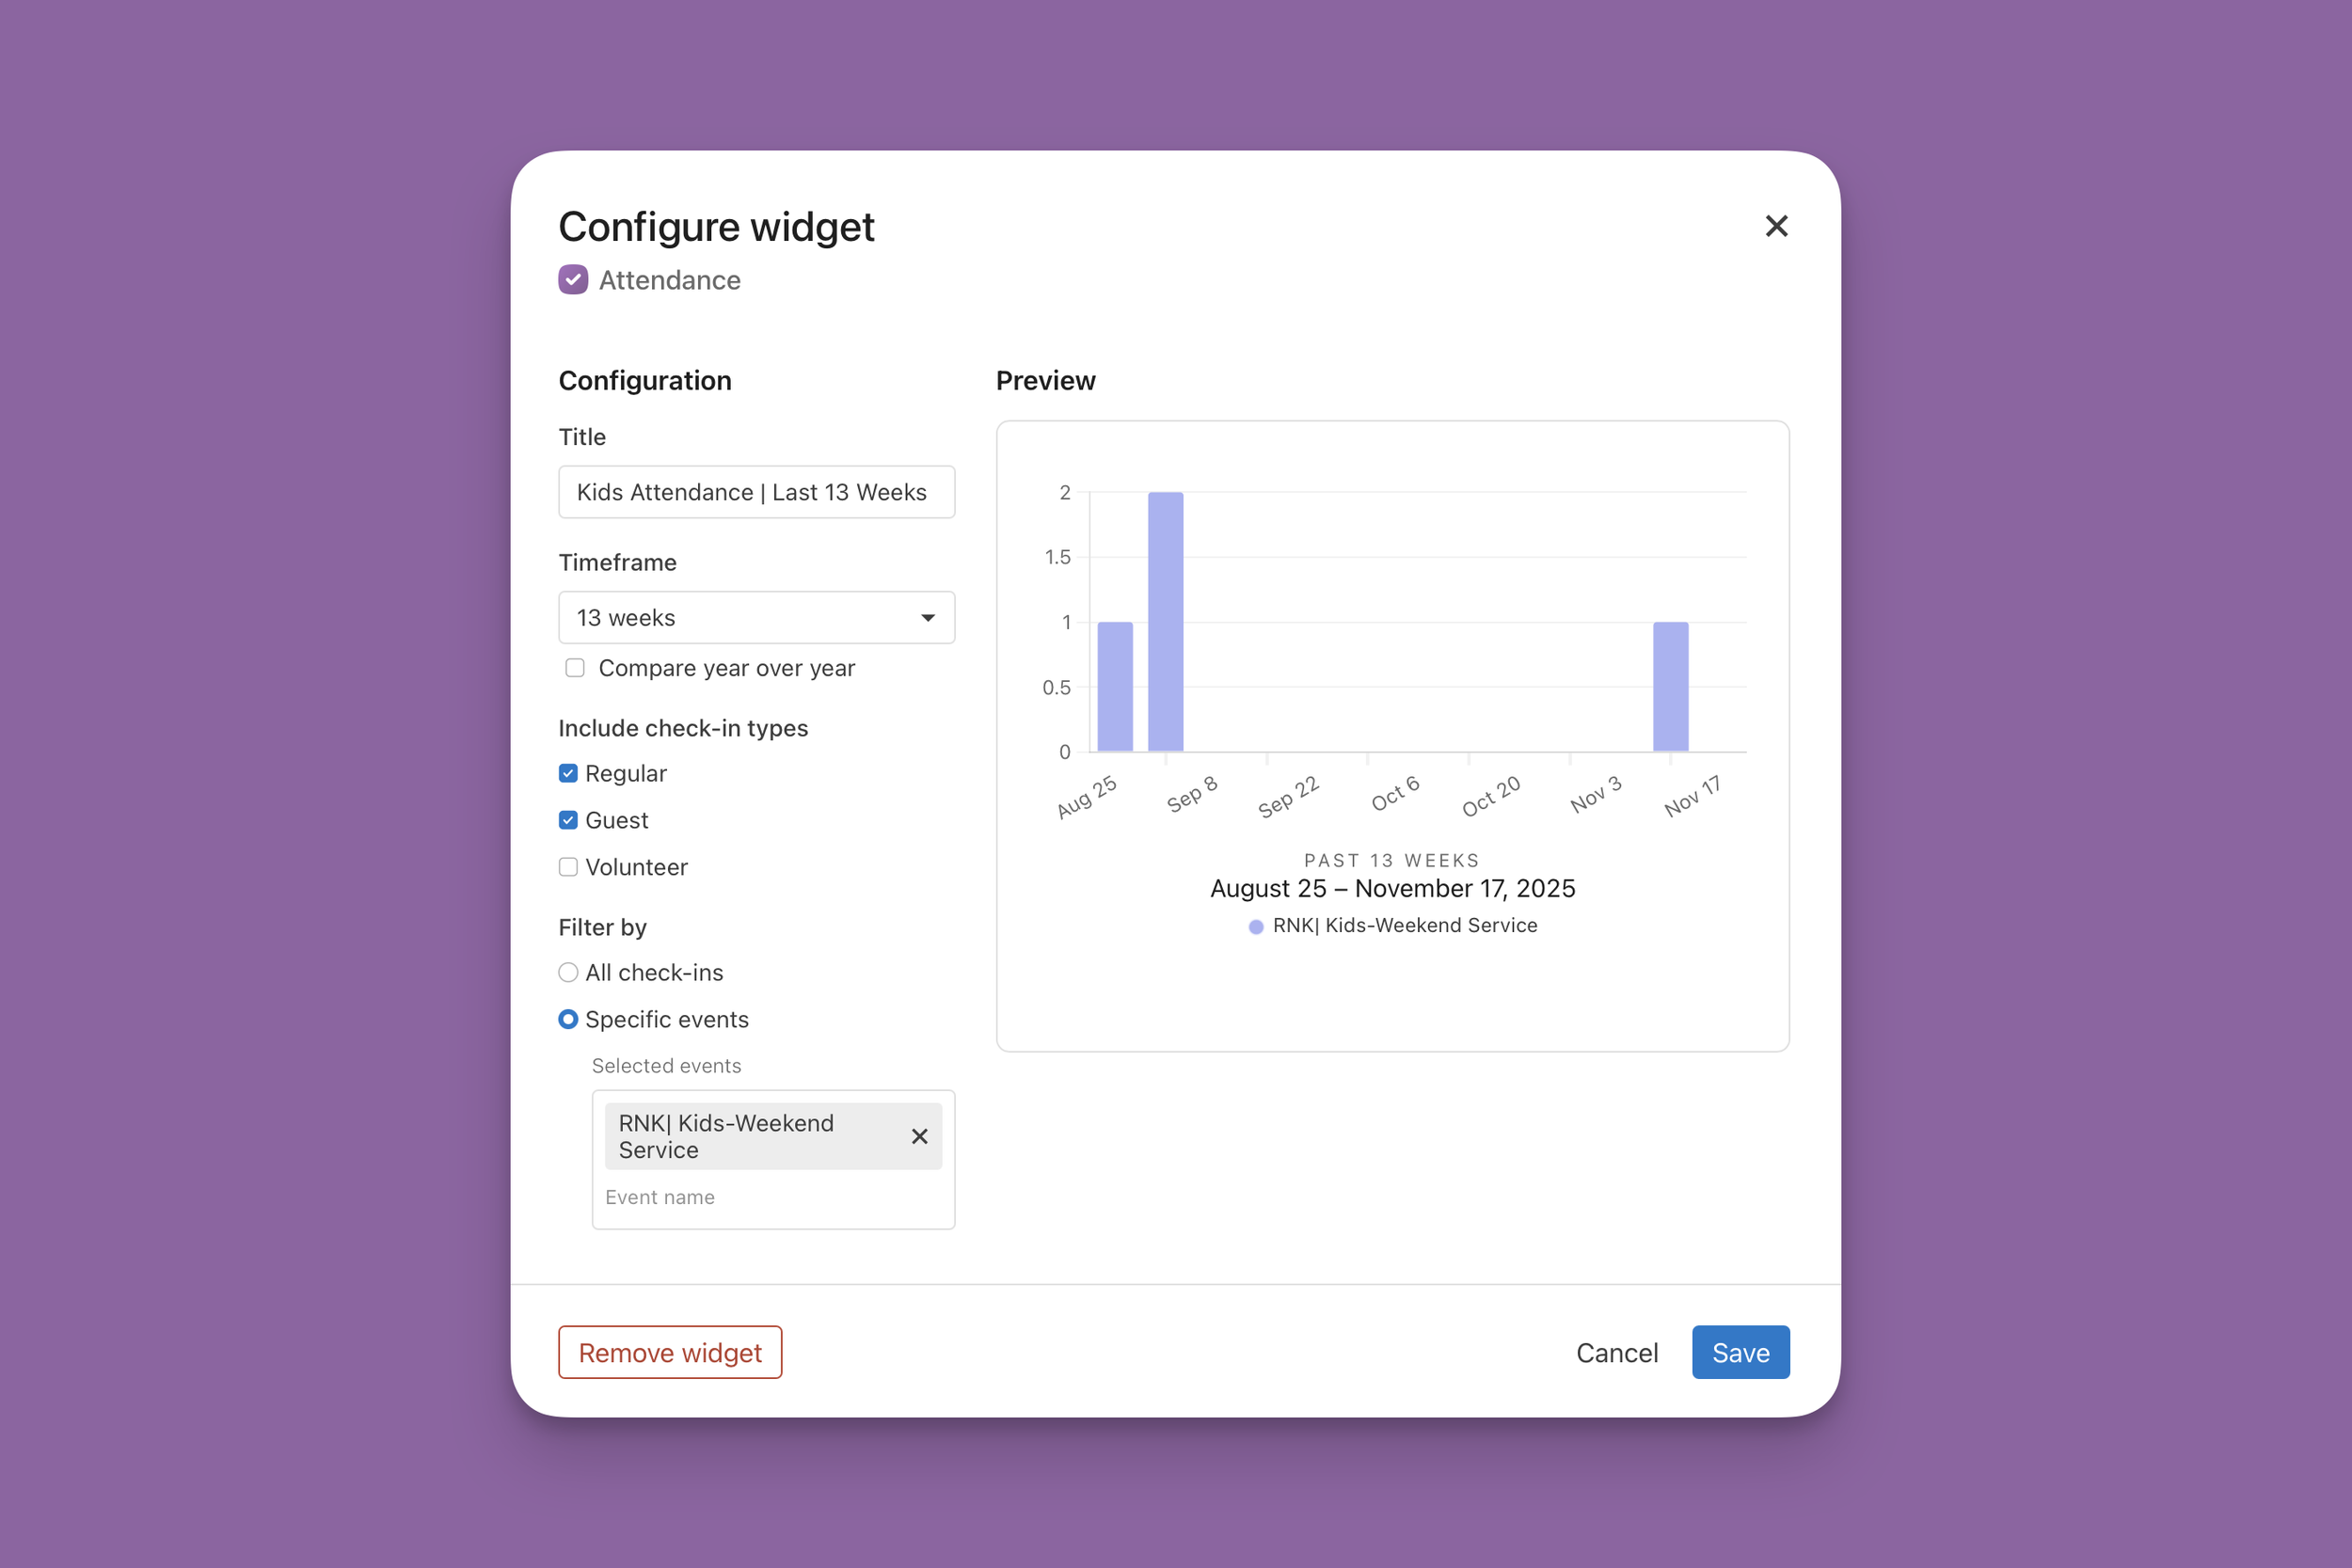
Kids Attendance | Last 13 weeks (Using Check-ins)
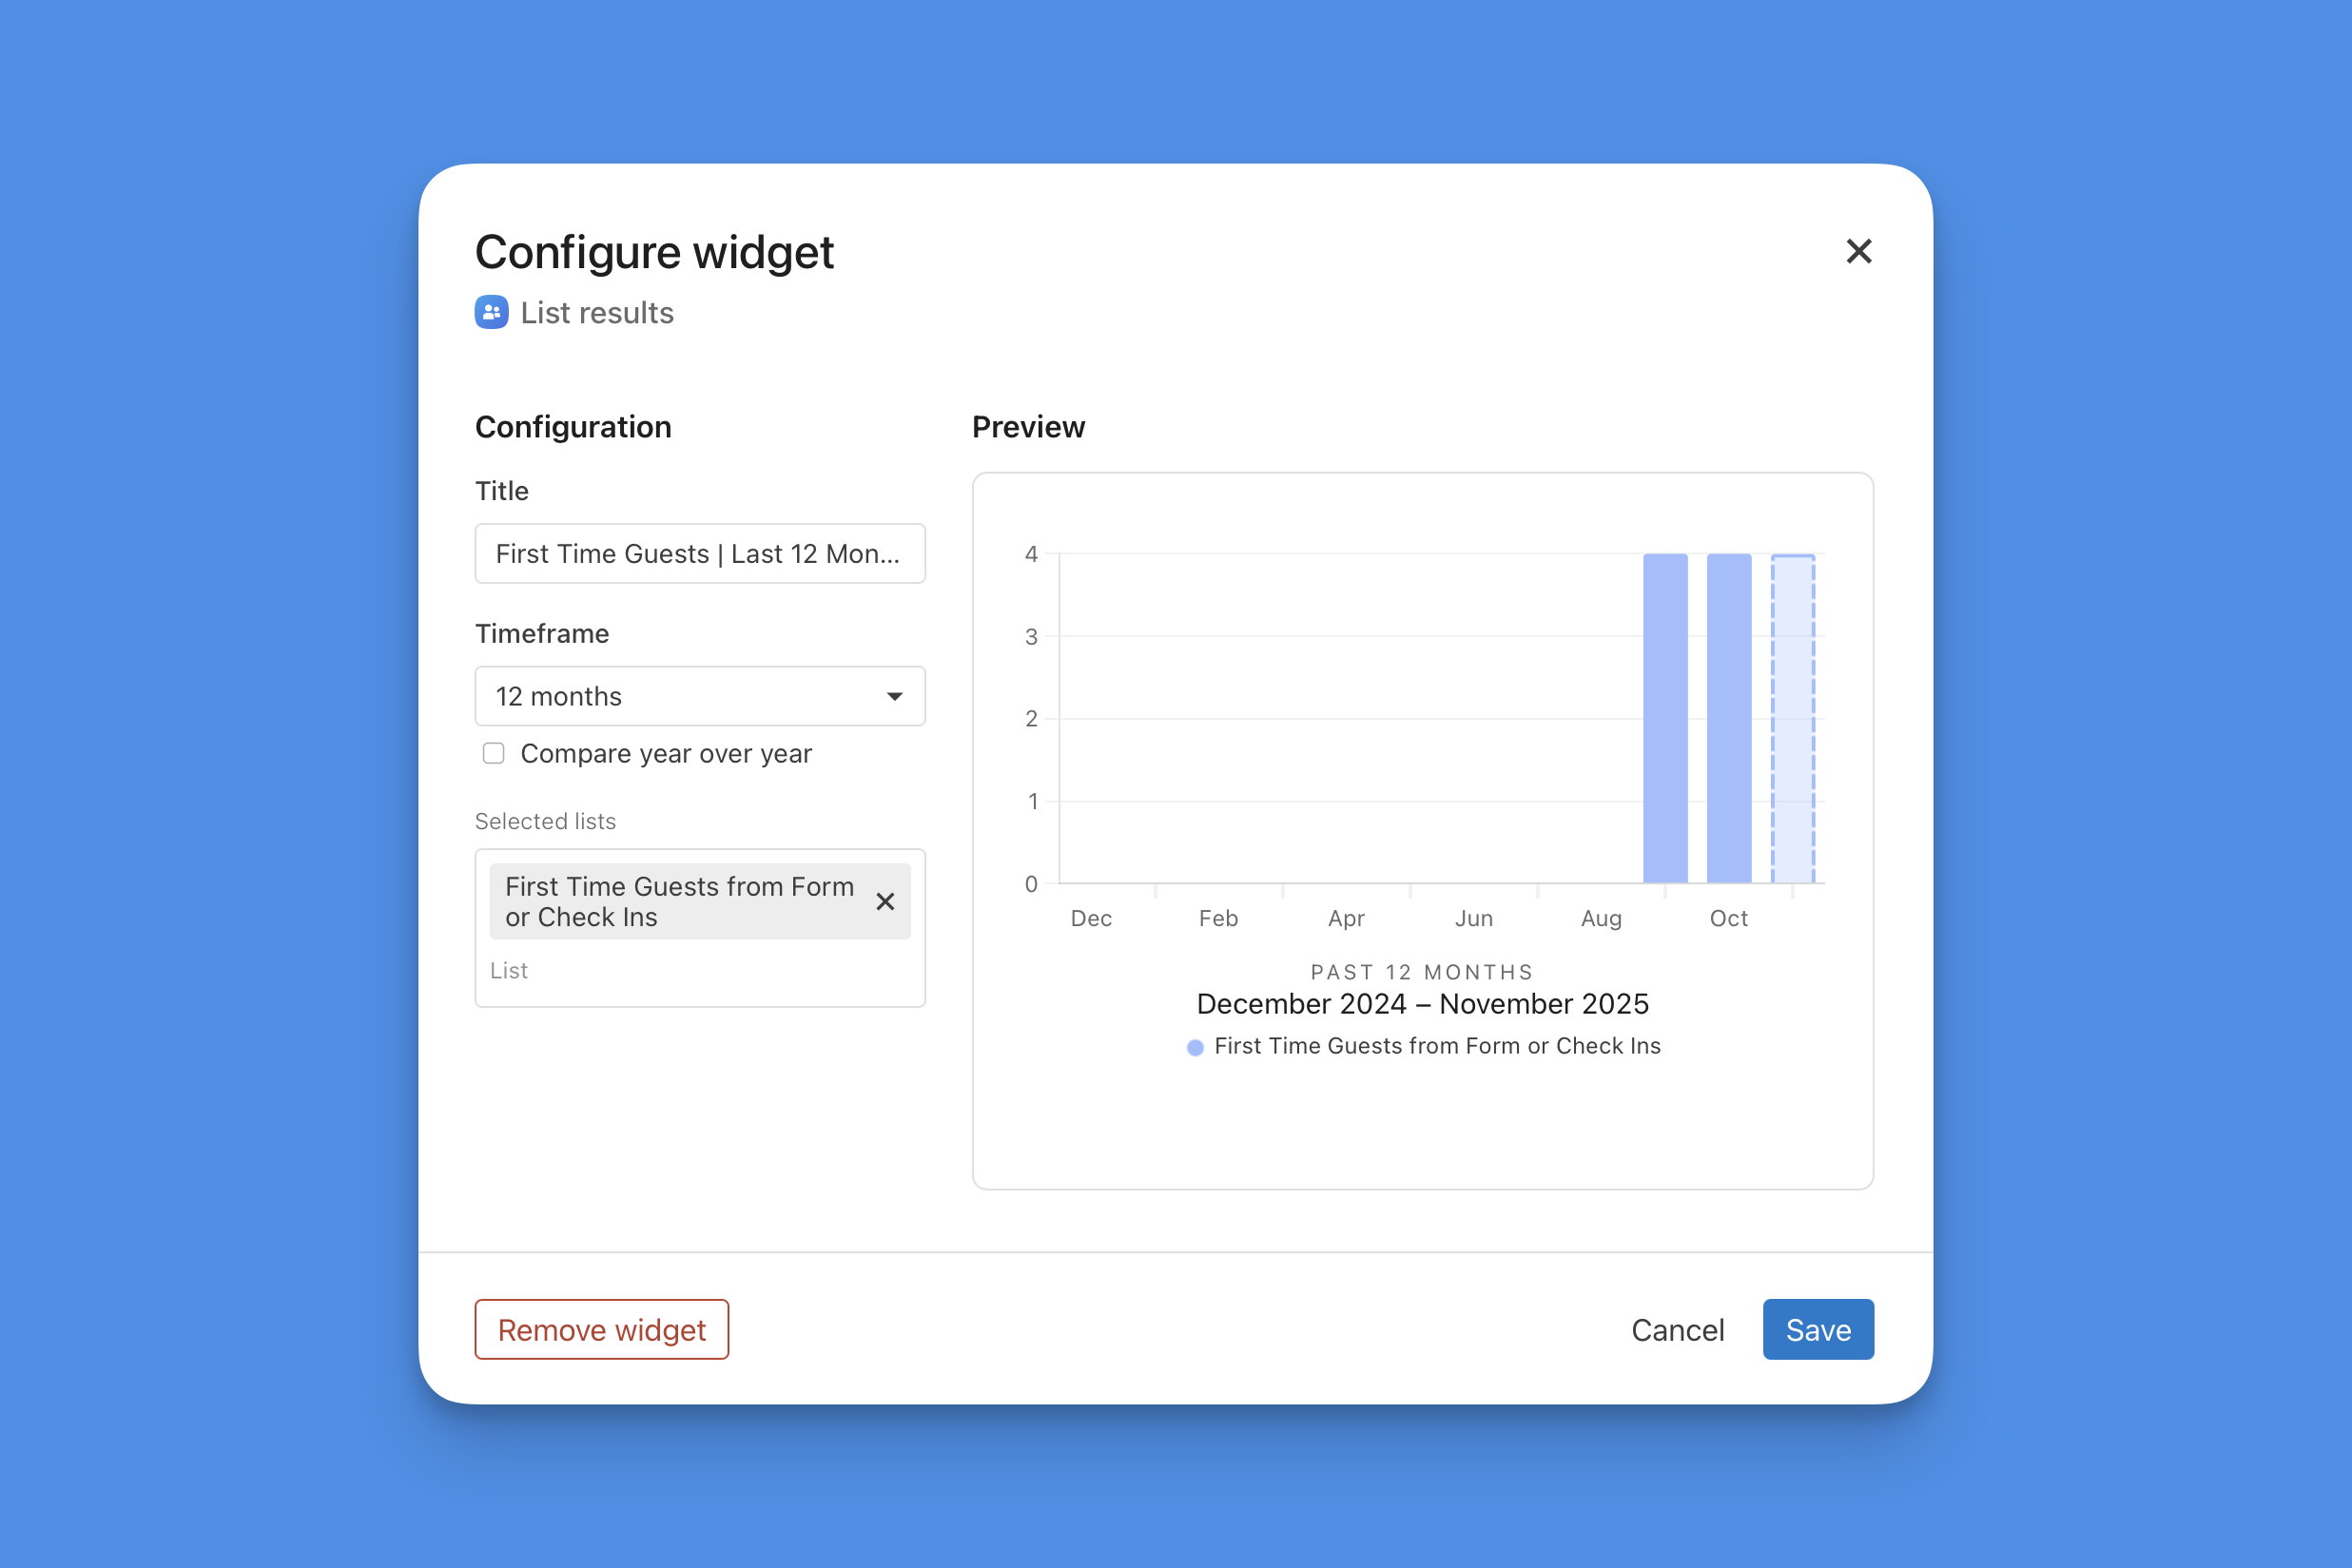
First-Time Guests | Last 12 Months (Using List Results to Combine Form Submissions and Check-Ins)
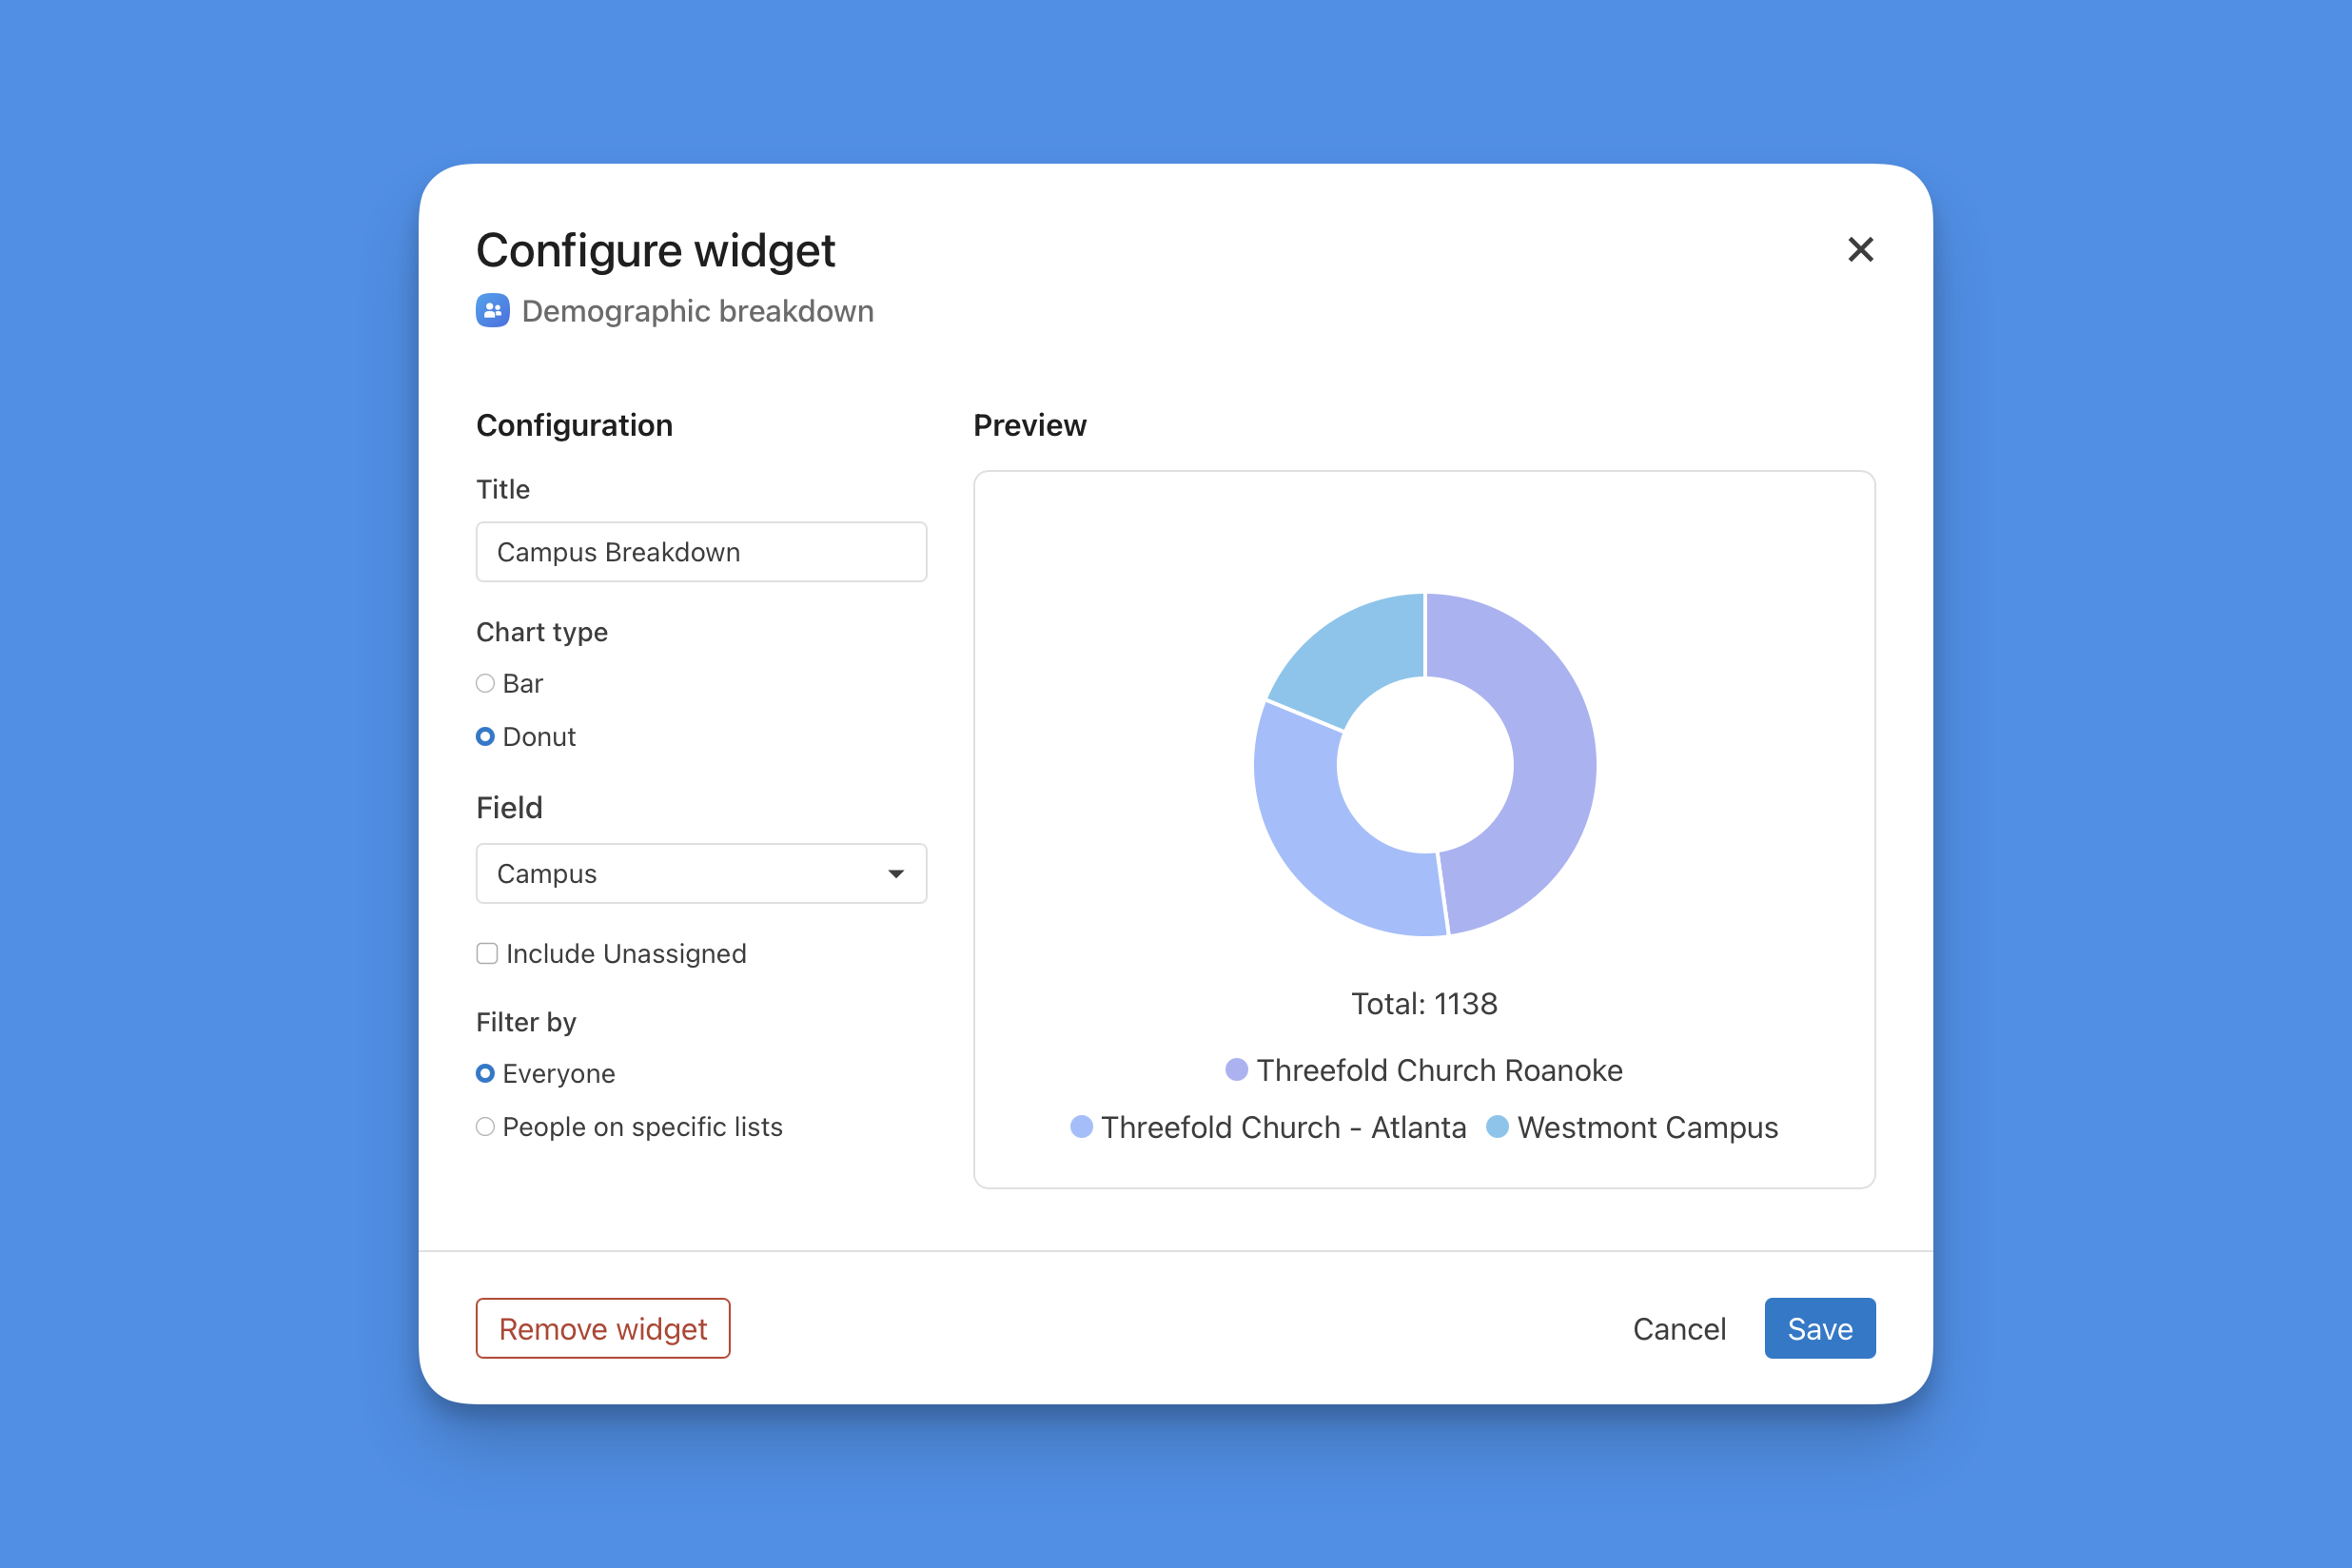
Demographic Breakdown | Campus
Demographic Breakdown | Gender
Demographic Breakdown | Age

Total Donors | Last 12 Months
Total Giving | Last 12 Months
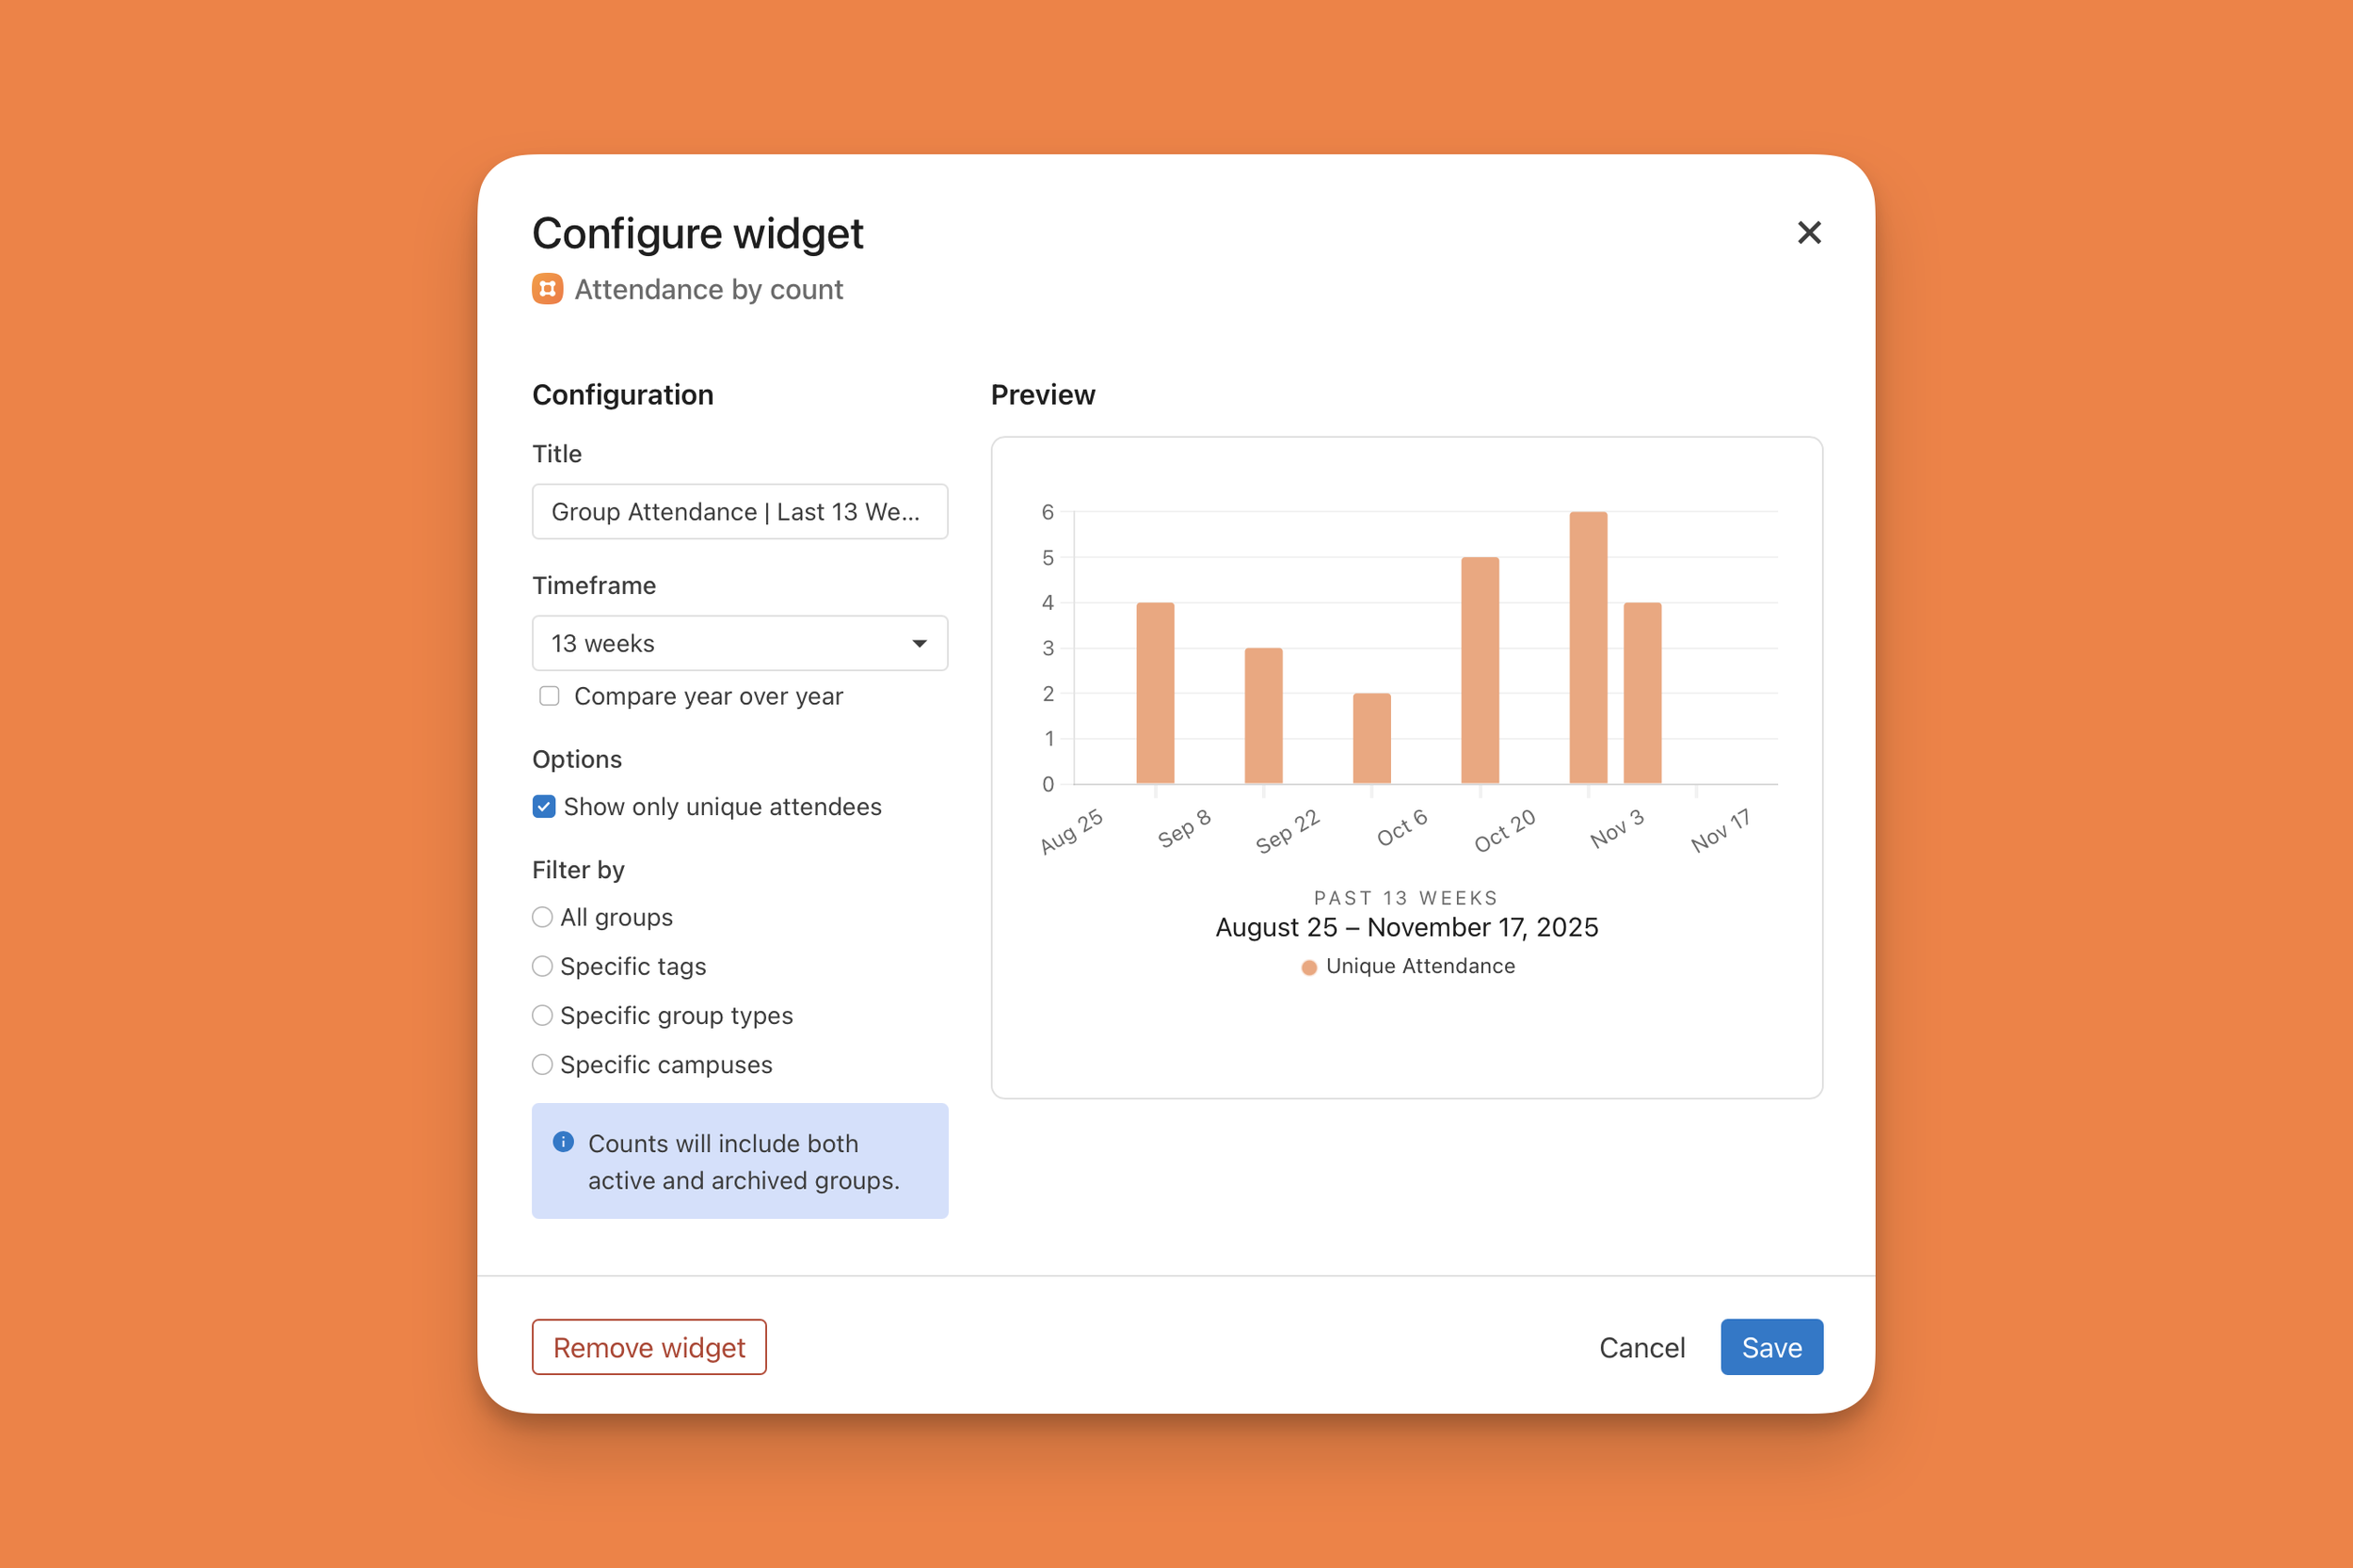
Groups Attendance | Last 13 weeks
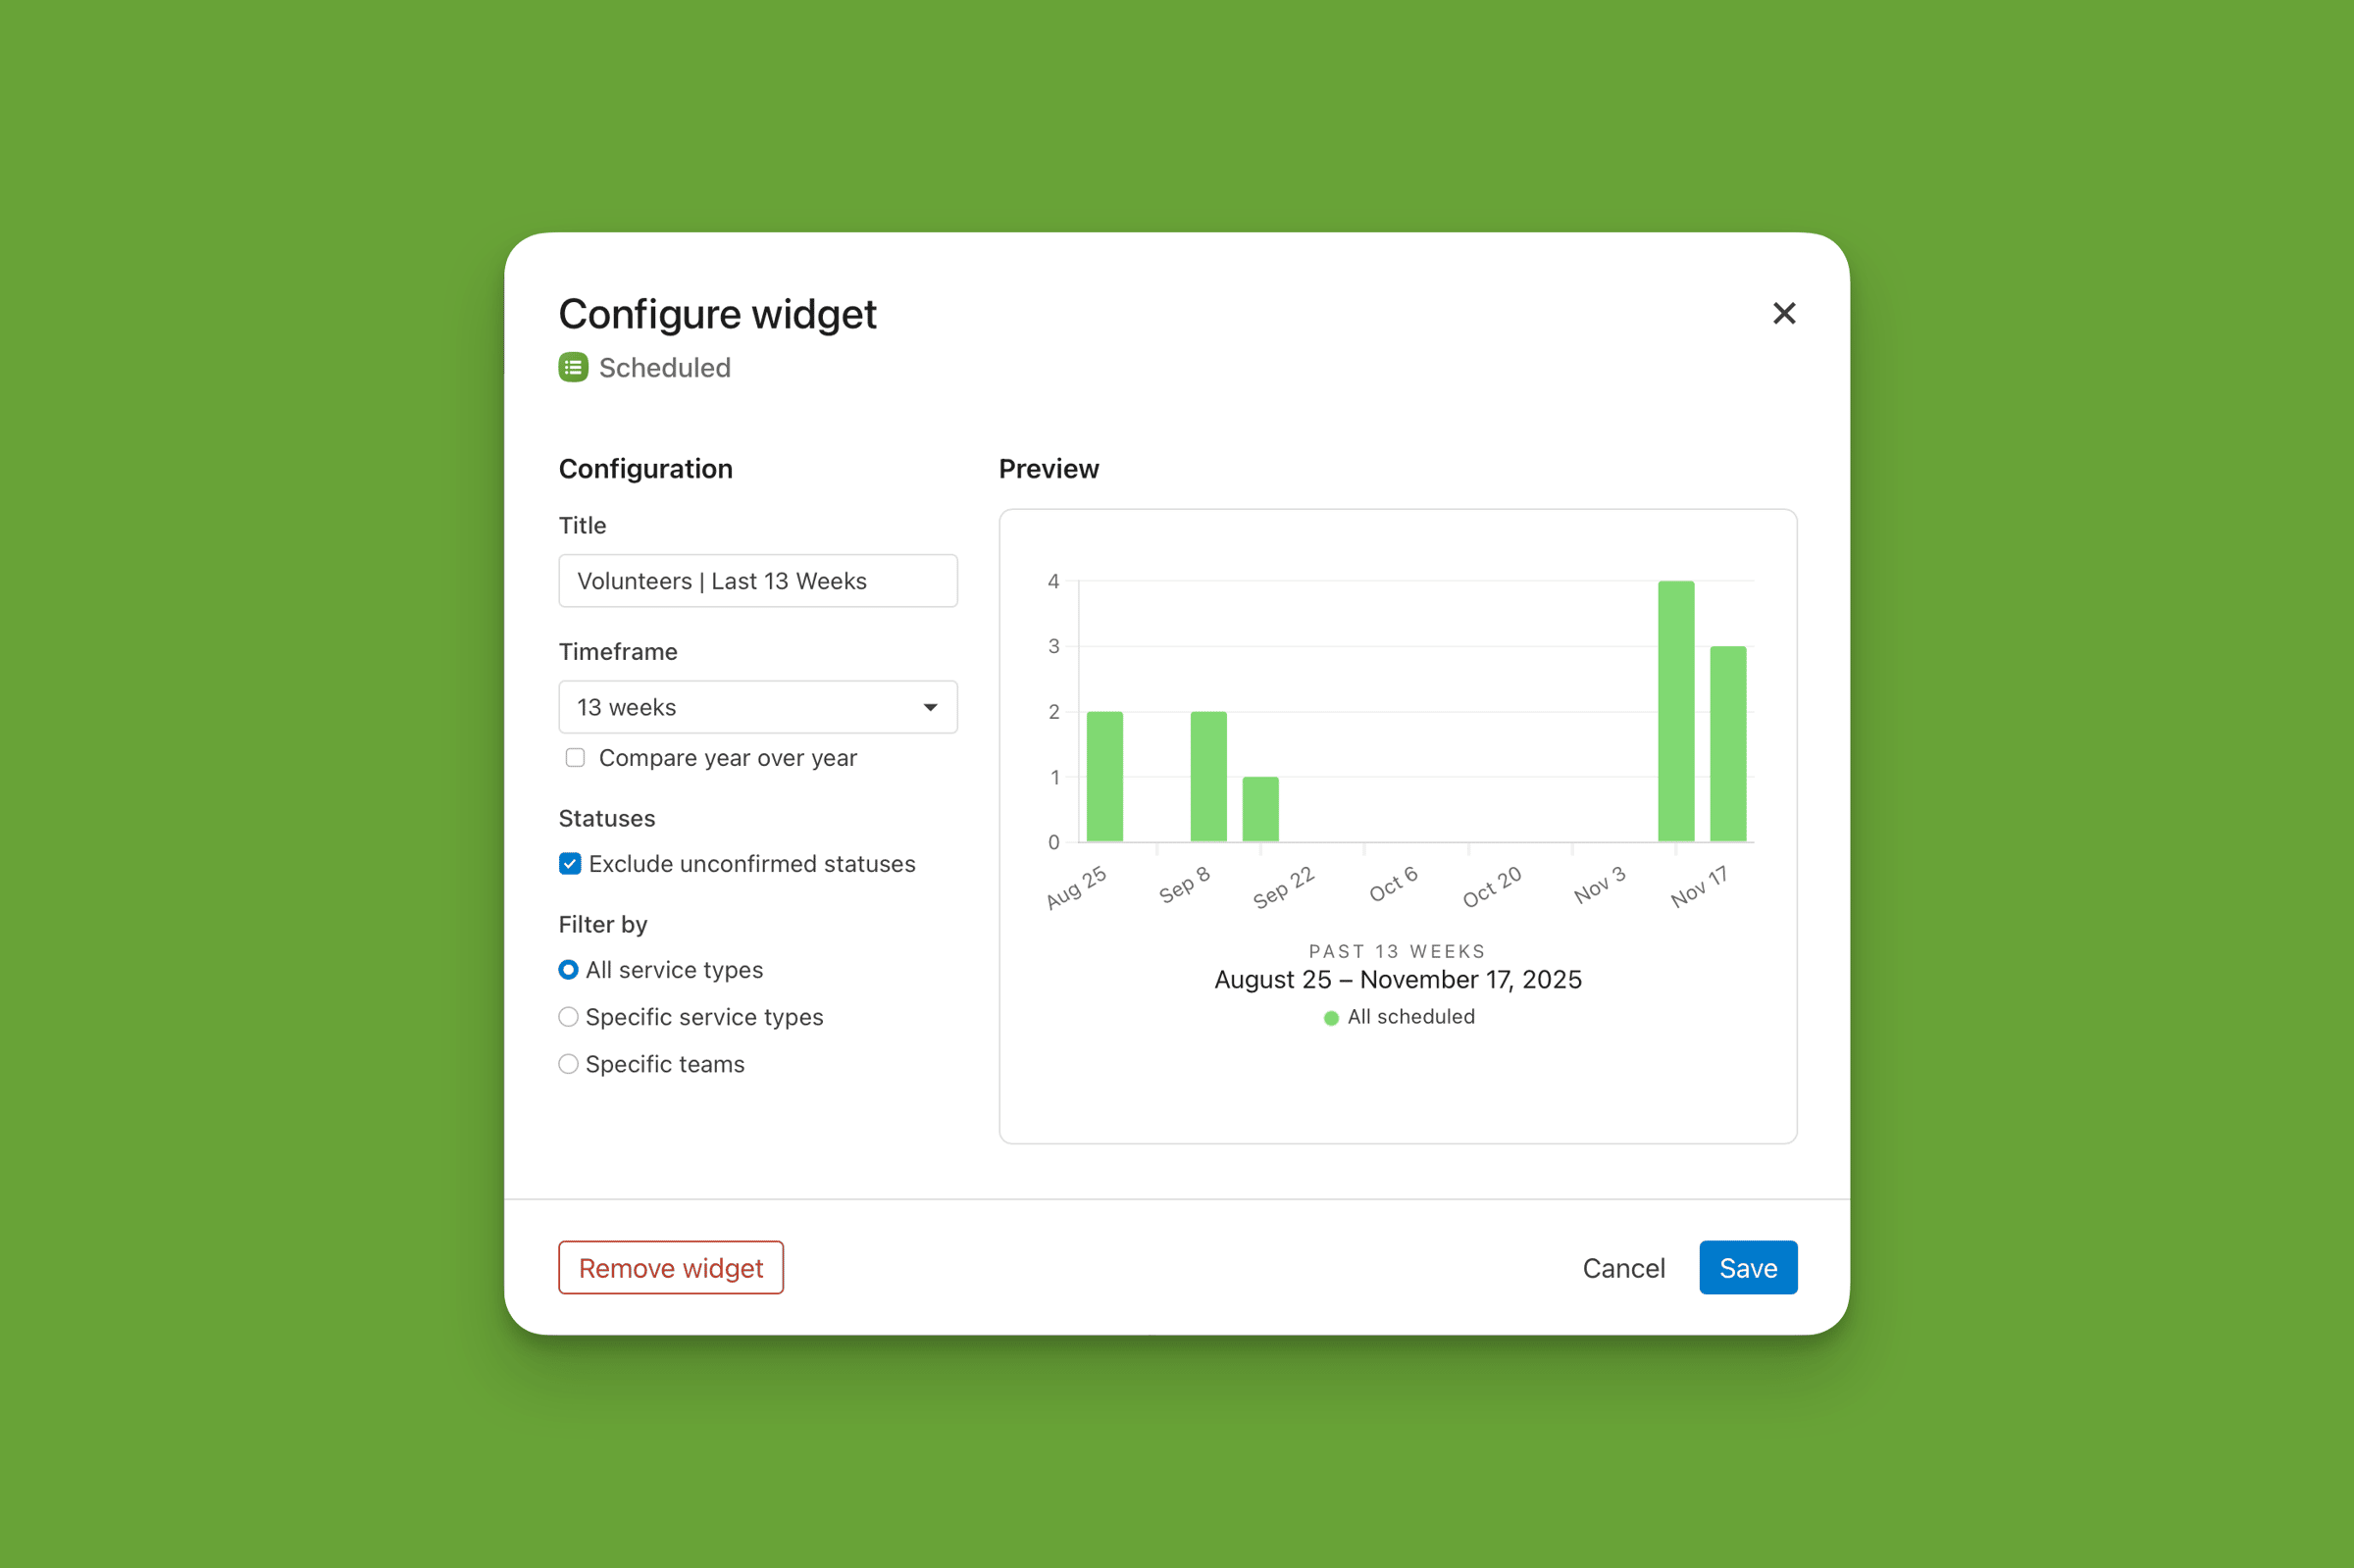
Volunteers | Last 13 weeks
Final Thoughts
Planning Center’s dashboard widgets offer a powerful way to visualize your ministry’s data. Whether you're tracking attendance, giving, or engagement, a well-designed leadership overview dashboard helps your team make informed decisions and stay aligned.
Take time to explore widget options, experiment with layouts, and share your dashboard with key leaders. With just a few clicks, you’ll transform raw data into actionable insights that support your church’s mission.
Kristin Emerson
Client Success Specialist, Threefold Solutions